


‘Yellen-omics’ & $4500/oz Gold Bullion
More Monetary Inflation Favours Gold and Bitcoin

Economics are often shaped by eras, viz: (1) Post-War World (1946-73), ended when the US cut itself away from the discipline of gold, (2) the Washington Consensus (1981-2008), when neo-liberalism, globalisation, fiscal discipline and free market thinking determined policy, and (3) today’s Free Money Era (2008-date), where activist governments use large deficits funded by zero interest rates and quantitative easing to support economies, seemingly paying homage to the ‘snake oil’ views of MMT (Modern Monetary Theory). Evidence, their GFC and COVID responses.
The current Free Money Era seems altogether less anchored and, like the late-1970s, made more unstable by monetary ill-discipline. Its high water mark, so far, has been the Biden Presidency, with its whopping fiscal deficits and imprudent funding. We dub these latter policies ‘Yellen-omics’, eponymously named after the last US Treasury Secretary, meaning a bias towards funding large-scale government spending by issuing Treasury bills and short-dated debt. Yet, it will prove hard for new incumbent Scott Bessent to do anything different. Indeed, the US Treasury’s latest QRA (Quarterly Refunding Announcement) treads an identical path.
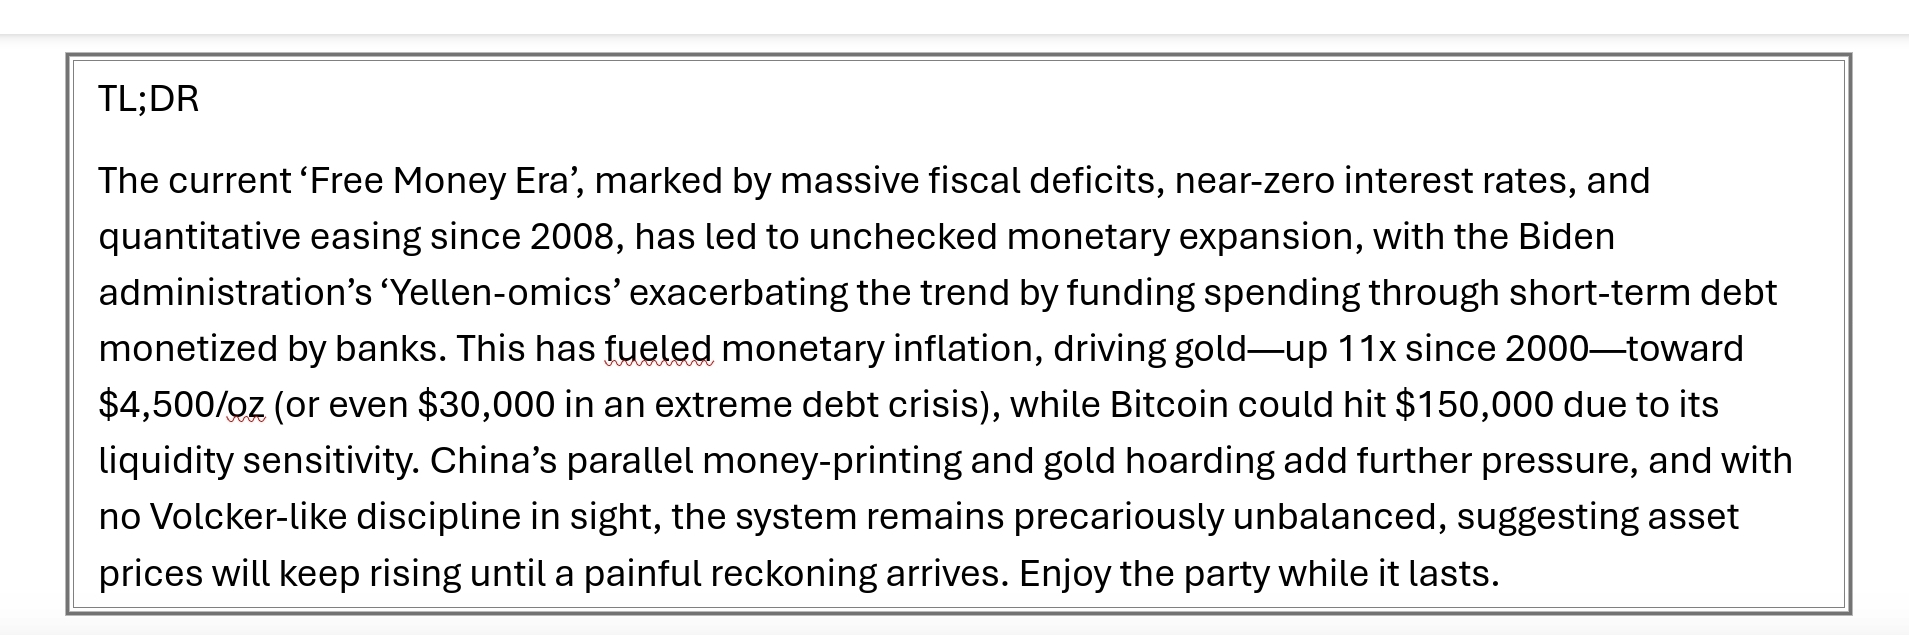
Banks’ balance sheets expand significantly as they hoover-up this preferred short-term paper, effectively ‘monetizing’ the Federal deficit. It’s essentially the same as JP Morgan cutting a cheque to the government. Consider, the chart below showing the outsized growth in banks’ Treasury holdings compared to conventional money supply growth. This confirms that we are entering a more rapid monetary inflationary World, and this will ultimately drive faster high street inflation. We know this party always ends badly. So, enjoy it while you can.
Monetary Inflation Hedges
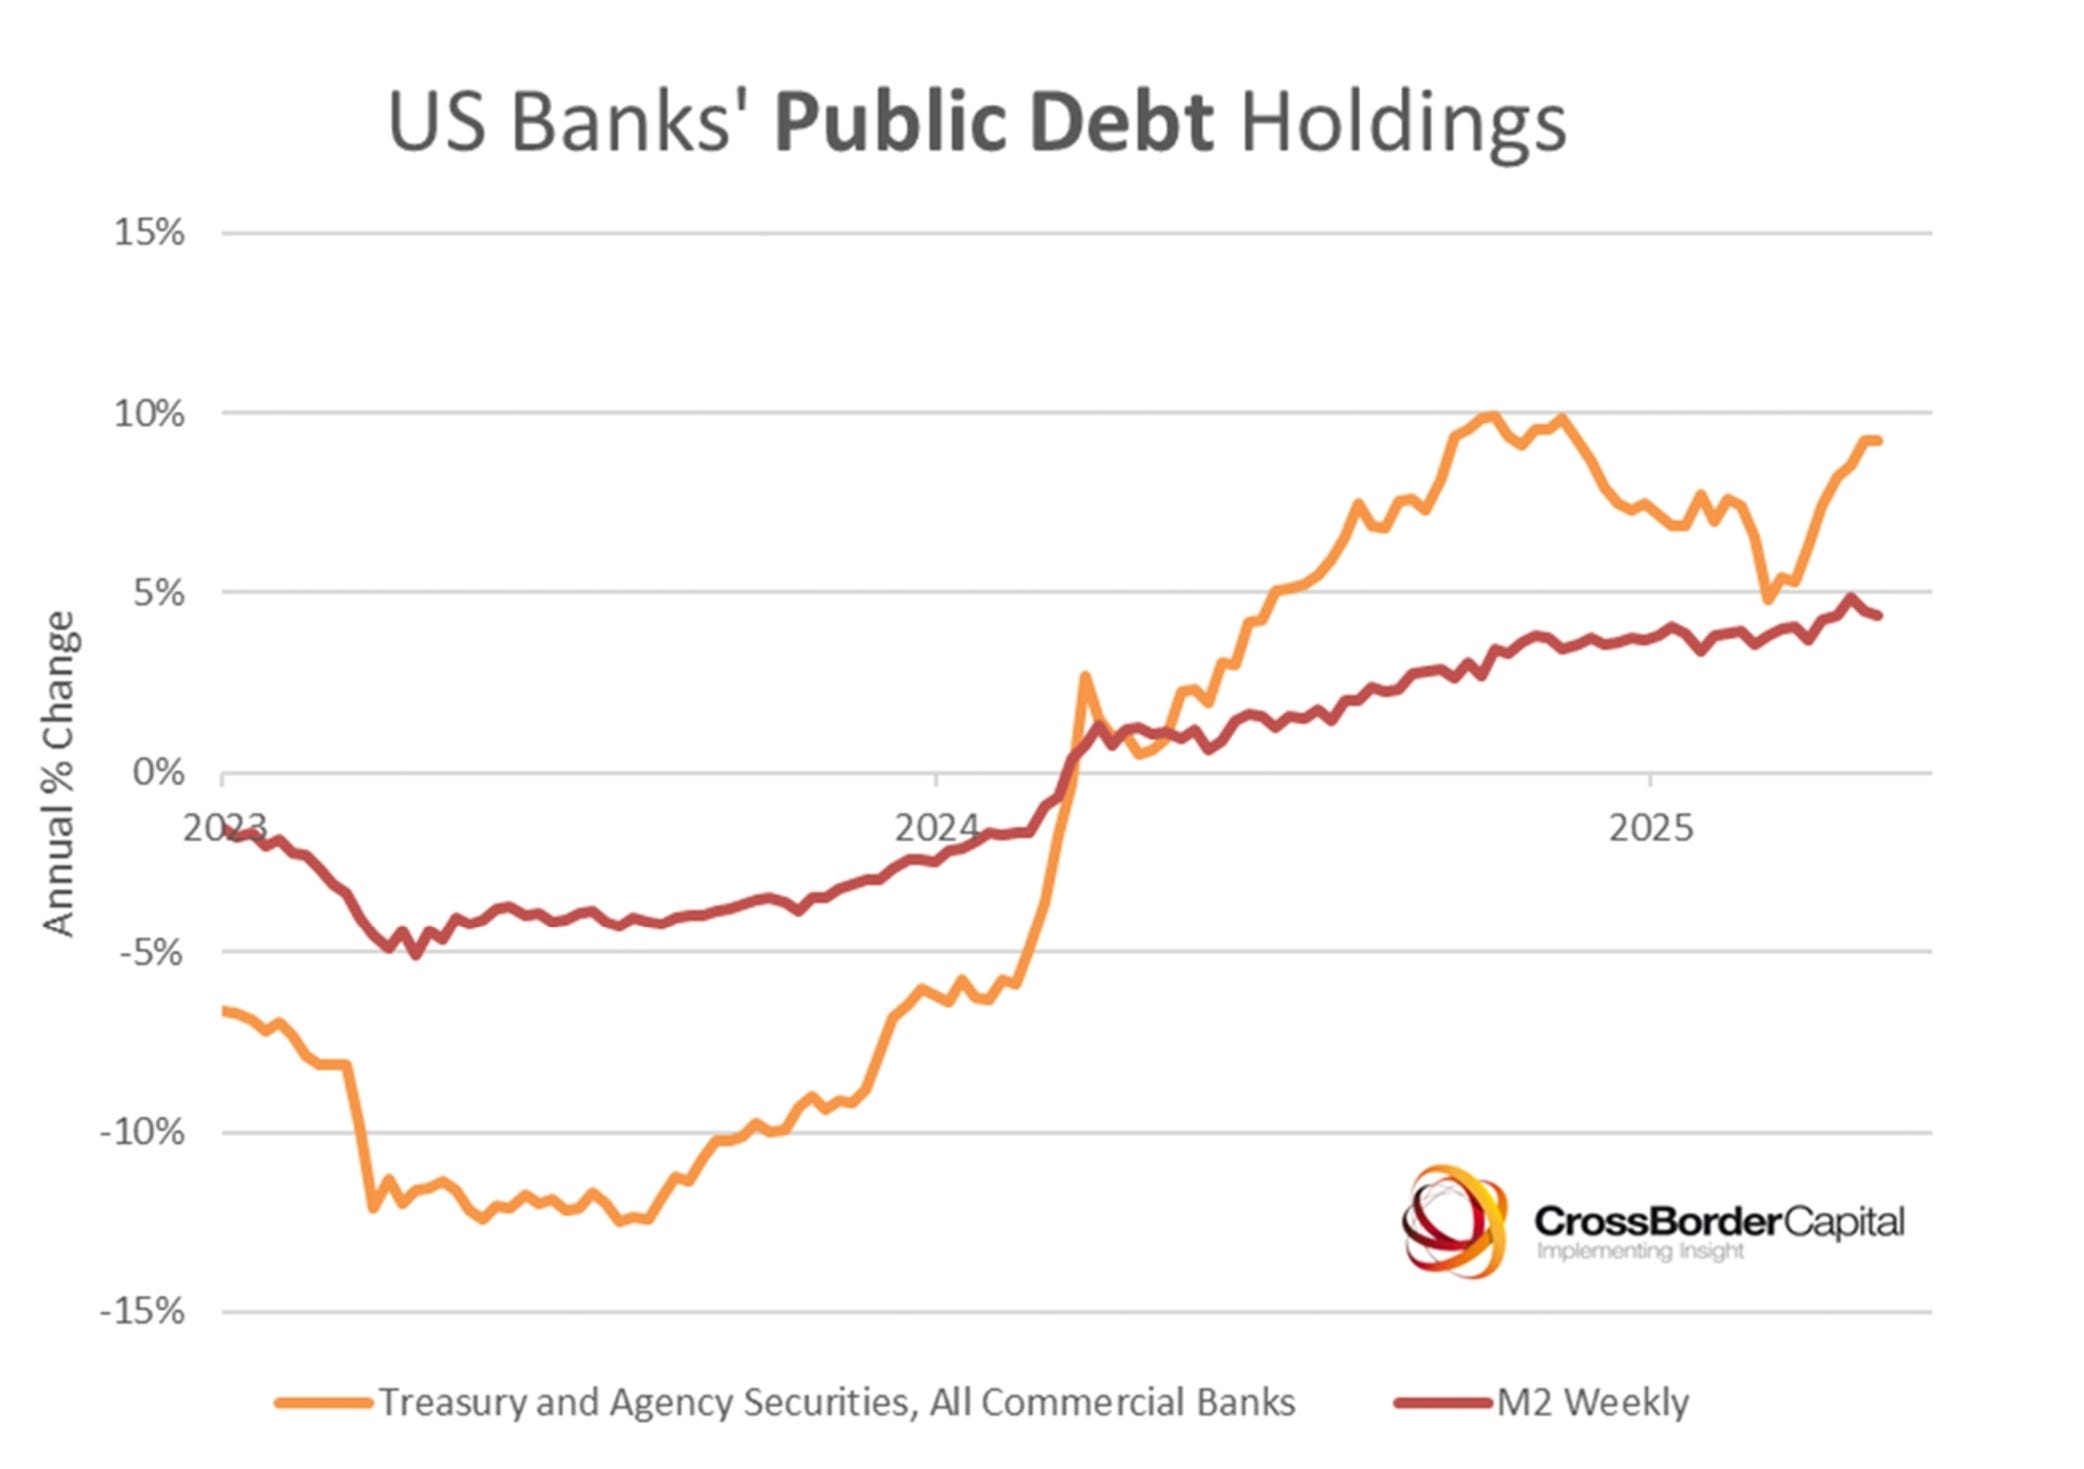
This reality of Yellen-omics and monetization can be seen in the reaction of the prices of monetary inflation hedges. Gold is traditionally the monetary hedge par excellence. Consider, the ‘real’ value of US marketable Treasury debt shown in the following chart since the early 1940s, measured in ounces of gold. The long-run trend in the ratio is a ‘moderate’ 1.6% per annum increase [spoiler alert: it still doubles every 44 years], but lately the fall in the ratio shows that gold has more than kept pace with public debt. Since year 2000, it has leapt in value by over 11 times, whereas debt increased by ‘only’ ten times. We have marked on the chart the implication for the gold price. It should hit US$4500/oz if the ratio to Federal debt tests the lower bound of the channel. Alongside, given its far greater sensitivity to liquidity, Bitcoin could easily test US$150,000.
Even though gold is more often thought of as a monetary inflation hedge rather than a pure hedge against excessive debt, the reality is that debt and liquidity move hand-in-hand over the long-term. Liquidity needs to be backed by high quality debt as collateral, and debt needs liquidity to facilitate its refinancing. Indeed, a stable debt/ liquidity ratio is often a necessary condition for financial stability.
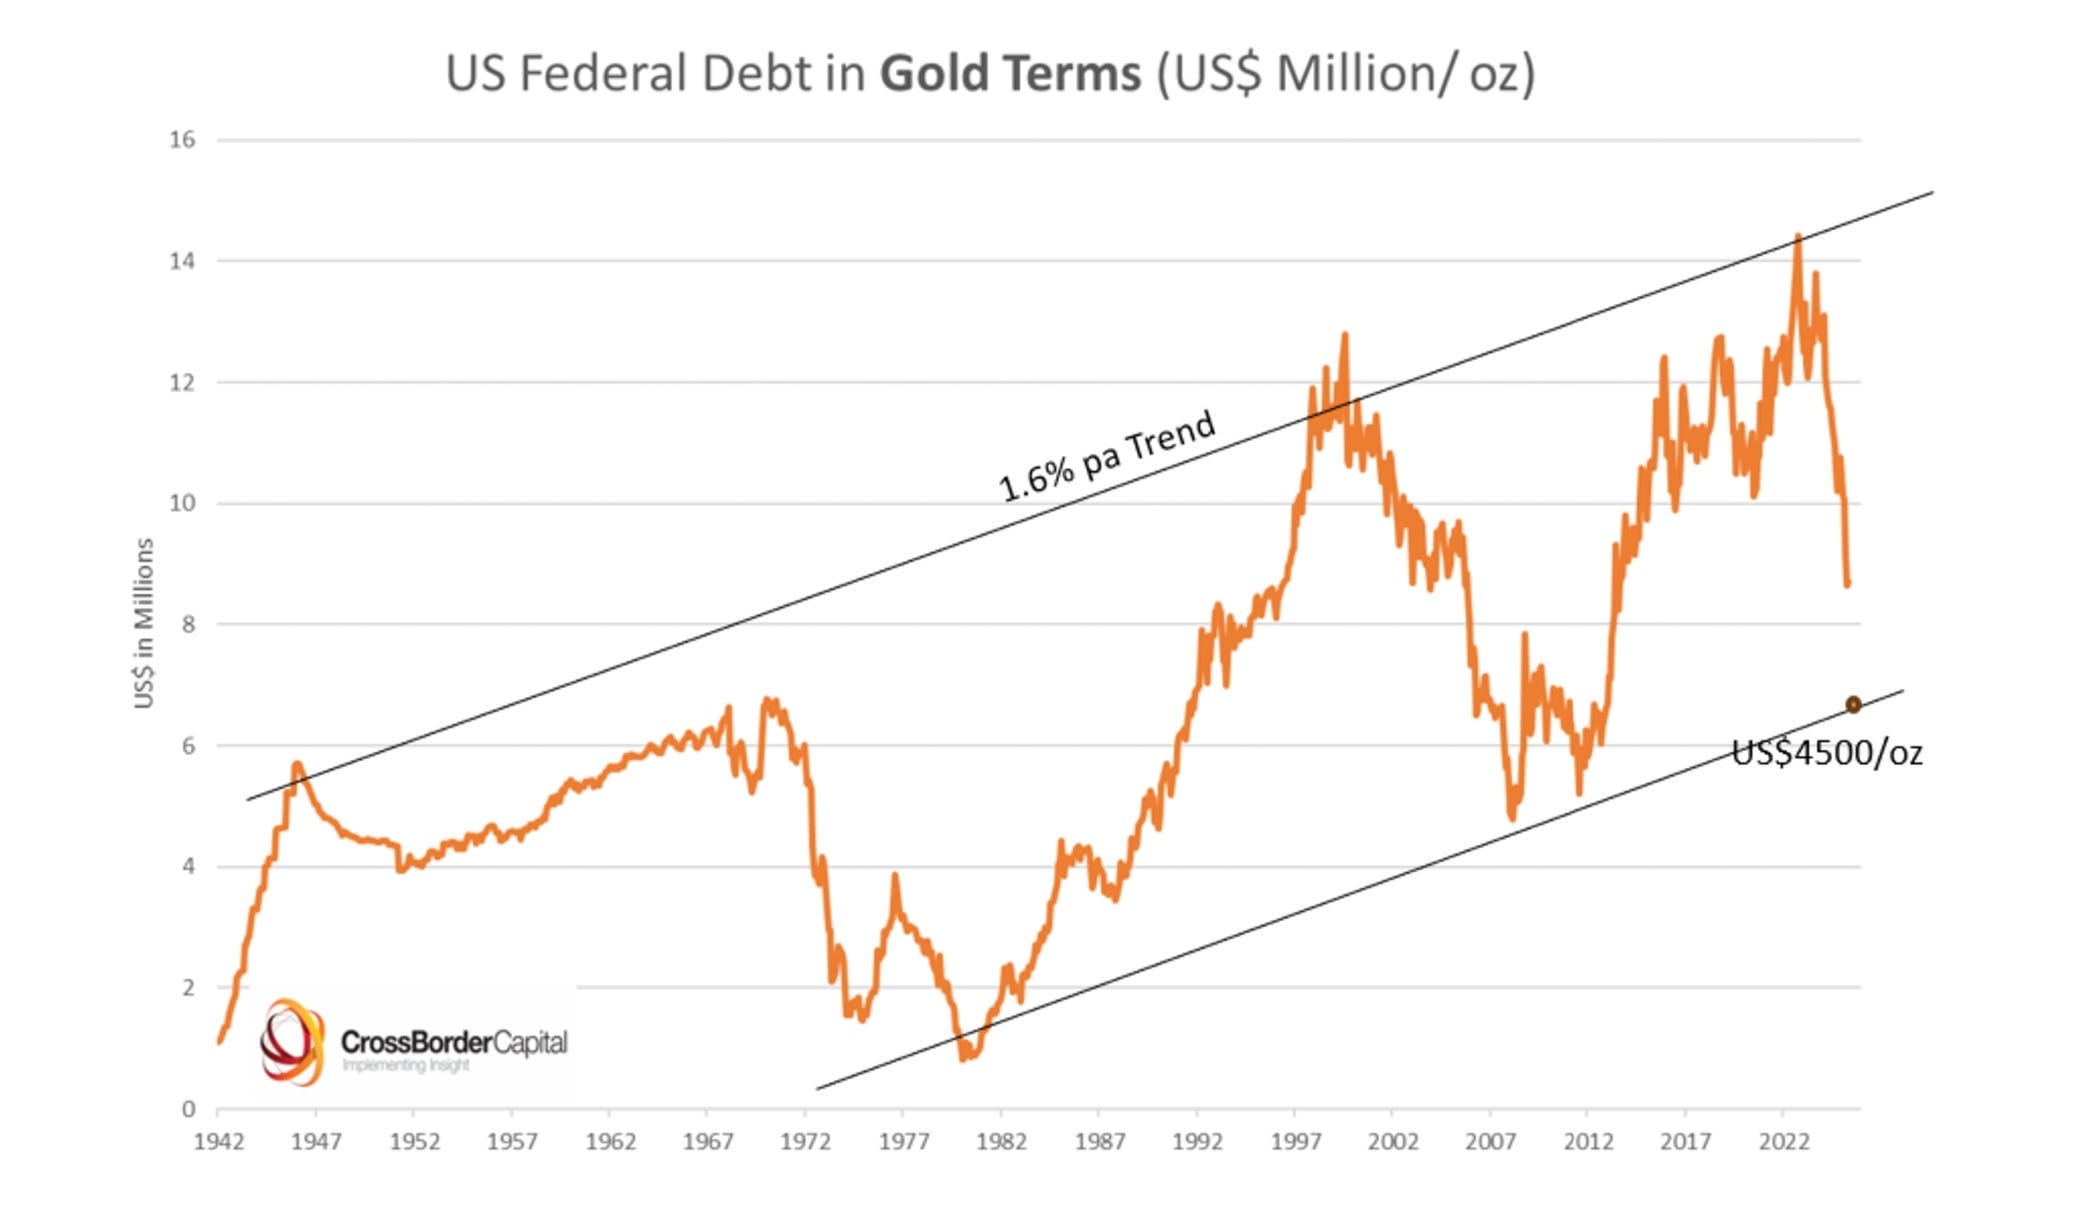
Lately, the buoyant gold price may also be fueled by additional concerns over this shift towards shorter dated issuance, and not simply the larger volume? Note that shorter dated debt incorporates more ‘liquidity’ than longer duration debt. The next chart compares the gold price with US real interest rates (TIPS) inverted. This highlights how for so long rising real rates (black line) coincided with weaker gold prices. And vice versa. That is until the start of imprudent US fiscal and monetary policies from late-2022: labelled ‘Yellen-omics’ in the chart. This clear break point sees gold prices catapult higher despite rising real interest rates. In other words, the opportunity cost of not holding gold then started to far outweigh the loss of interest receipts from holding cash and bonds.
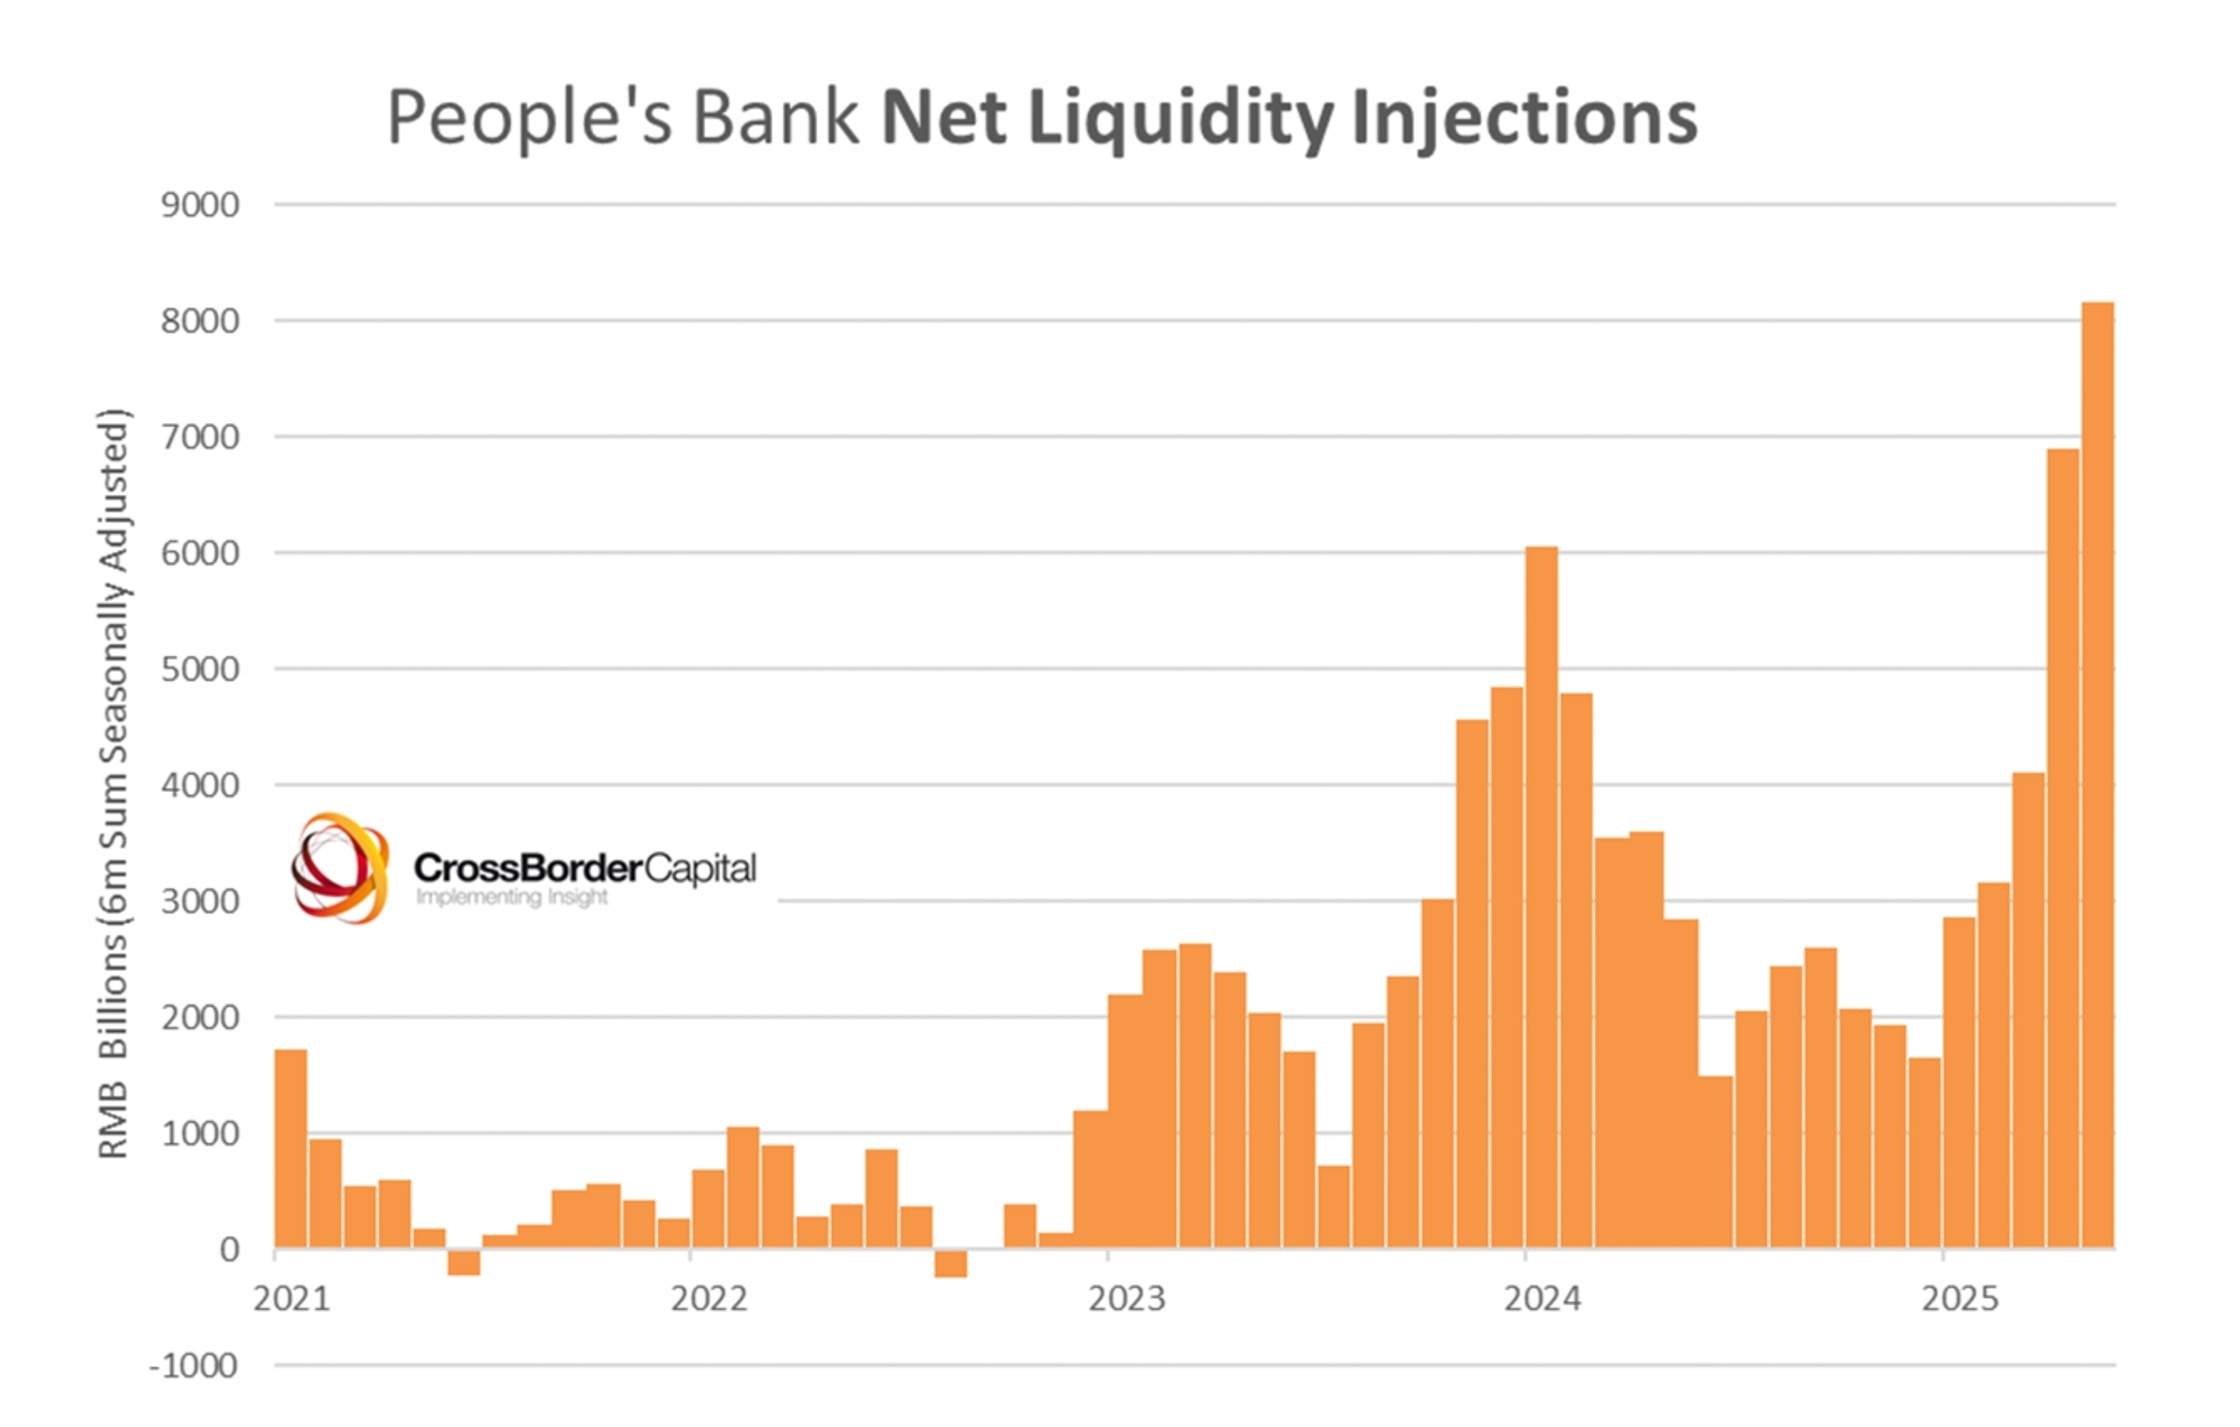
Could gold climb higher than US$4500? Certainly, because it is not just the US printing money, China has also opened the spigots (see chart below) and is simultaneously hoarding gold. Latest data show that China has injected a whopping RMB8.3 trillion (US$1¼ trillion) into her money markets over the past six months. We reckon they will at least have to double this in order to get out of her debt problems.
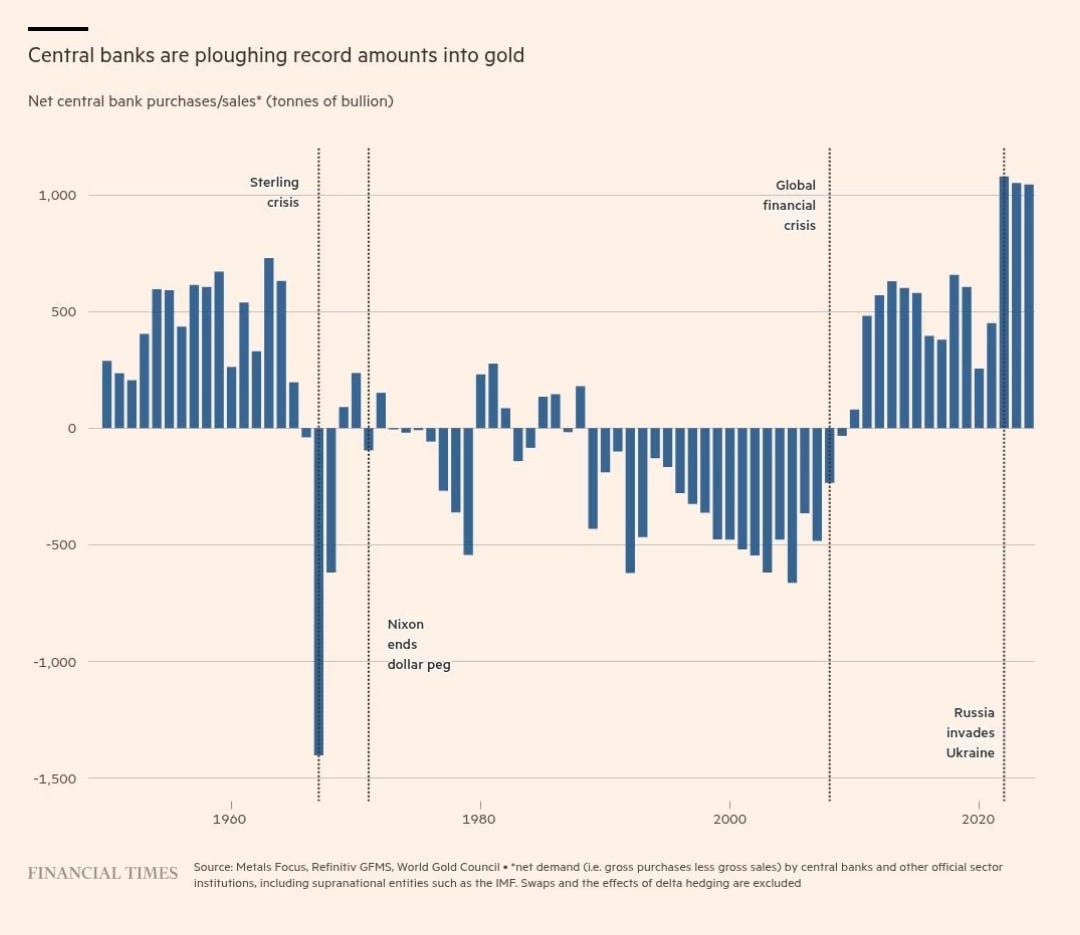
Gold is in demand from many other Central Banks as this compelling graphic (above) from the Financial Times confirms.
But sticking just with America, consider what could happen if the monetary anchors were entirely ditched. Many are fond of saying that if things can’t go on they wont. However, in the monetary sphere ‘money illusion’ means that they typically go on for far longer than expected. Consider again the Federal debt chart. Assume a (marketable) Federal debt level of just US$30 trillion. Next take the low point on the chart in the late-1970s, coincident with the appointment of hard money man Paul Volcker as Fed Chair, when the real value of Federal debt stood at barely US$1 million per ounce. Taken together, these would point to the gold price hitting a whopping US$30,000/oz!
Never say never? A Federal debt target of US$30 trillion is unrealistically low and could easily be reached by year-end. What’s more, Jay Powell doesn’t act like another Paul Volcker. Just saying!
Would you consider the GENIOUS act monetisation of the deficit through stable coins or are stable coins a new source of financing the deficit through global bank transfers (global savers financing the deficit through purchase stable coins)? Does your GLI factor in stable coins as a source of liquidity?
What do you think about the expectations of serious people regarding Bitcoin reaching $200,000 by the end of the year / mid-2026?
Is it realistic?