Global Liquidity is a key driver of asset prices and a major influence on the price of Bitcoin. The chart below shows a scatter plot between Global Liquidity (GLI$) and Bitcoin (BTC$) expressed in log terms to evidence the power law that joins them. The standard regression results are reported. The data shows that increases in Global Liquidity drive the price of Bitcoin higher, with the curved relationship indicating that larger increases in liquidity have an increasingly smaller (but still sizeable) impact on the price of Bitcoin.
Global Liquidity refers here to the flow of financial capital through World markets that can be used for asset purchase in the financial economy and investment, trade and consumption in the industrial economy. It also reflects the ease with which assets can be converted into cash. Global Liquidity comprises Central Bank interventions; credit provision by banks and shadow banks, and cross-border flows. We estimate it totals around US$175 trillion, or two-thirds bigger than World GDP.
It is worth more closely examining both data sets to test the robustness of their relationship. Taking changes over six weeks in weekly data for Global Liquidity and Bitcoin, the following chart calculates correlation coefficients for each lag dated in weeks. It also performs a one-sided Granger causality test (GC Test in chart) to confirm that liquidity leads. These results confirm our earlier statements that Global Liquidity is strongly Granger causal in a statistical sense and that its impact on Bitcoin is positive and with a lead-time concentrated around 11-13 weeks. The ‘earliest’ statistically significant impact on BTC$ comes after 5-weeks and the latest after 16-weeks. The near zero GC Test statistics (black line) tells us that from lag week-7 one-way causation cannot be disputed.
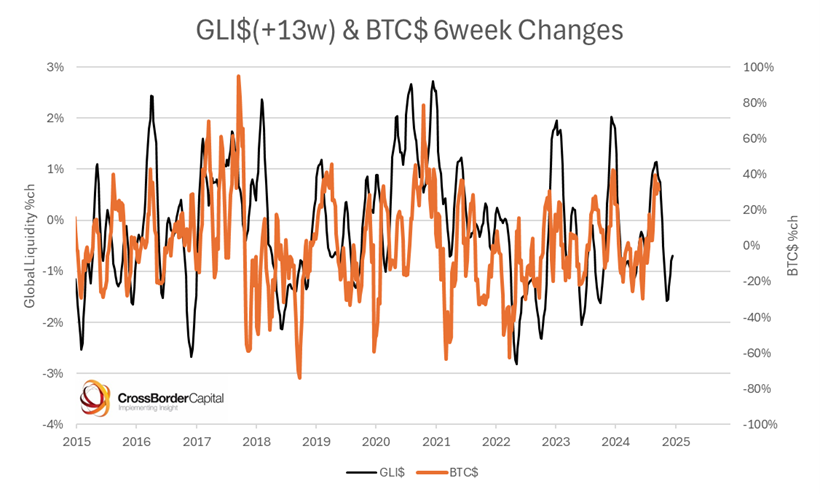
The actual relationship is traced out in the next chart. This reports weekly data from 2015 onward. The orange line is the 6-week change in the Bitcoin price and the black line the equivalent change in Global Liquidity. Global Liquidity has been advanced by 13 weeks to emphasize that it leads.
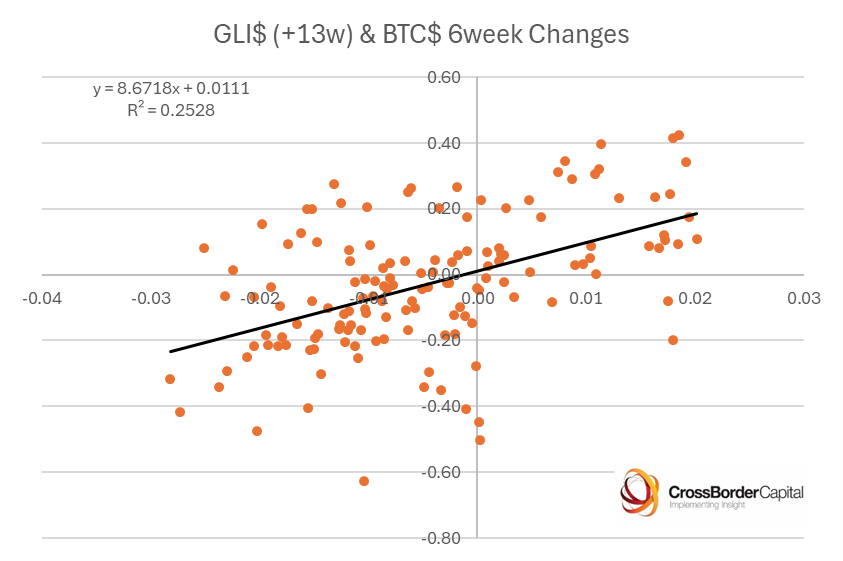
The next two scatter diagrams examine the stability of these results. The first plots the entire weekly data sample starting from 2015; the second plots a sub-sample of the same data from 2022 onward. The statistical ‘fit’ is tighter in the later sub-period, but the loading on lagged Global Liquidity is large in both cases and, reassuringly, broadly similar. We caution about extrapolating these precise elasticities forwards, because from the first log-log chart we can see how the impact of Global Liquidity could fall over time. Nonetheless, these results suggest that Global Liquidity still has a large and continuing influence on Bitcoin prices.
Intensive Versus Extensive Influences on Bitcoin
Because it is comparatively new, not fully ‘seasoned’ in the markets and subject to jibes and much skepticism, Bitcoin is a tricky investment asset to understand. Put another way, there are likely two sets of drivers: an intensive margin, which tells us how a notional average investor will allocate assets, including Bitcoin, and an extensive margin that measures the ‘learning’ or diffusion effect of Bitcoin. Think of the latter, like the earlier examples of the internet and mobile phones, where growth follows an S-shaped pattern: slow at first, then accelerating rapidly, before a slow maturation.
To give a concrete example, think of an ‘average’ investor allocating 1% of their US$100k assets to Bitcoin, and let us assume that this ranges between zero and 2% over the investment cycle. In other words, allocations increase from US$0 to U$2000. Now assume that initially 1000, then 10,000, then 100,000 and next 1 million investors progressively invest in Bitcoin. The average pool of funds channeled into Bitcoin jumps from US$1000 to US$1 billion, and it can then swing between US$0 and US$2 billion.
These two effects intermingle, but essentially the intensive margin, or asset allocation decision, depends, among other things, on systematic influences such as the pace of monetary inflation. We measure this by Global Liquidity. Therefore, we can think of the rise in the price of Bitcoin as partly related to Global Liquidity (intensive margin) and partly related to a ‘take-up’ effect (extensive margin). Global Liquidity has a trend, but also cycles significantly, whereas the diffusion of Bitcoin is likely to be trend dominated. It is plainly unusual to see both effects coming together successfully in one asset.
The Intensive Margin: Influences on the Asset Allocation Decision
Bitcoin, like gold, acts as a hedge against monetary inflation, but it has a higher sensitivity or beta to liquidity, which we estimate at around 4.5 times, compared to 1.8 times for gold. See the latest liquidity beta estimates for different assets in the chart below. It also tends to be more strongly affected by investor sentiment. Therefore, Bitcoin tends to rise alongside other risk assets, like NASDAQ, even when the gold price is falling. Correspondingly, Bitcoin is likely more vulnerable to a souring in investor sentiment than gold.
Statistically, we can untangle some of these effects. The following chart evidences the results from a variance decomposition of the systematic influences on the Bitcoin price. We have used our in-house measures of US investors’ sentiment, as measured by their relative portfolio exposure to risk assets.
The biggest impact on BTC$, some 40%, comes from Global Liquidity. The changing risk appetite of US investors makes up another 22% of the impact. Gold and Bitcoin appear to have a complex relationship. They are not independent influences and typically move together, so that trend increases in the gold bullion price reinforce the trend in Bitcoin. However, the gold/ BTC$ ratio curiously feeds-back negatively on to the Bitcoin price.
This particular set-up is termed an ‘error feedback mechanism’. It shows that shocks to Bitcoin and/ or gold show up in the other asset. When the gold/ BTC$ ratio moves away from some specific threshold, there is an adjustment that steers the ratio back on course. This process explains why over the long-term gold and Bitcoin trend together, but over short-term periods, say, Bitcoin’s price jumps, whereas gold shifts lower. The rationale is that there is an active asset allocation operating between the two assets, where arbitrage ensures periodic re-balancing. Evidence how in the recent market rally, gold initially jumped while Bitcoin stayed broadly static. Lately, Bitcoin has surged higher, but gold has fallen back.
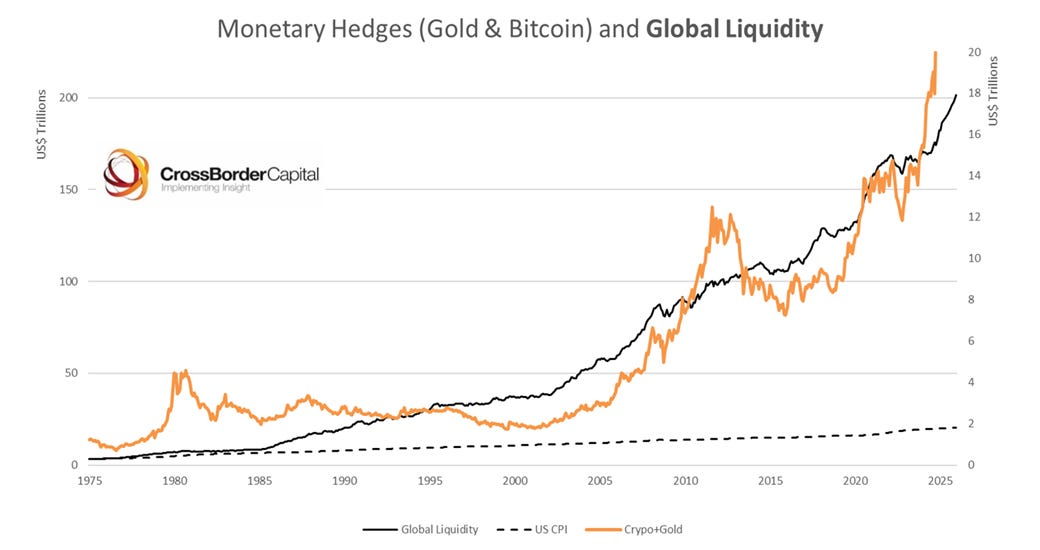
Yet, as the following chart shows, both gold and Bitcoin (orange line) follow the trend in Global Liquidity (black line), which confirms them as monetary inflation hedges. Bitcoin and gold are here combined together in a basket based on their market capitalization). As reference, US CPI, a measure of high street inflation, is shown on the chart (broken line).
Making the distinction between monetary inflation (an increase in the amount of paper money), high street inflation (an increase in the cost of a basket of consumer purchases) and asset price inflation (rises in stocks, bonds, real estate and other investments) is crucial. Evidence the paths of monetary inflation (measured by the secular rise in the pool of Global Liquidity); high street inflation (taking the US CPI basket indexed back to the same starting point) and the market capitalization weighted mix of gold and Bitcoin. Since 1972, Global Liquidity has increased by an incredible 108-fold (or 9.1% pa), compared to a near 8-fold rise in US consumer prices (or 4% pa). Gold has kept up better (up 8.0% pa), and more recently since Year 2000 gained (with Bitcoin) at a faster 8.9% annual clip, compared to a 6.4% annualized increase in Global Liquidity and a 2.6% annual rise in US CPI.
We conclude that gold and Bitcoin are monetary inflation hedges and not necessarily high street inflation hedges: that depends on other things. We expect sizeable monetary inflation over the coming years because of the pressing need to monetize debt and to afford the growing welfare bills mandated by governments. Investors, therefore, need to own monetary inflation hedges to protect their portfolios against a loss of purchasing power. Gold and Bitcoin both demonstrate significant up and down price cycles that we have tried here to explain, but the compelling fact is that both trend higher with Global Liquidity.


That was a great article!
How can we explain the decline in crypto+gold market cap between 2013-2016 despite liquidity trending upwards? Has it got to do with the slope of the curve, i.e. rate of liquidity growth? In other words crypto+gold can correct in an environment of increasing liquidity if the rate of growth becomes lower than the previous period?
Hi Michael,
Question regarding GLI lag times - in general it's about 12 weeks. But can it be further broken down by the liquidity component driving the GLI.
Like would there be a difference if GLI improves from lower bond volatility (bigger multiplier effect) vs CBs doing QE or some policy pushing money out of RRP, or the spending of TGA account.
Do these liquidity sources have different time effects to trickle down into markets or it doesn't really matter?