
The ‘Too Much’ Growth Problem
Don’t fear a recession in earnings; fear an asset repricing led by bonds

In financial markets there are few unrelated events: in fixed income markets there are even fewer. The core risk for investors is not that earnings fall into recession. It is that higher nominal growth (NGDP) forces bond yields upward, repricing equities through lower multiples even if activity remains resilient. Worldwide NGDP is expanding at the strongest pace for over two decades.
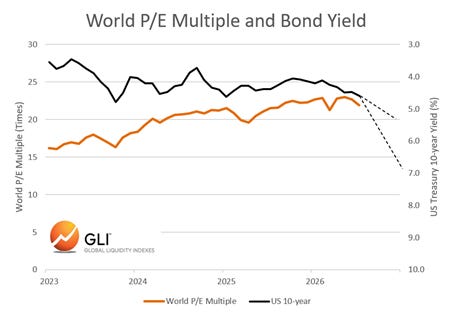
Consider, the chart below. This compares the World equity market P/E multiple (trailing earnings) with US 10-year Treasury yields (inverted on right scale, black line). Rising bond yields are a constraint on higher valuations. Indicative projections (broken lines) hint at the scale of repricing, e.g. a 5½% yield would push down P/E multiples below 20x, or by around 10%, while a 7% yield could nearly halve multiples (and hence stock prices) to around 12½x. Put another way, this shows why strong economies don’t always have strong financial markets.
Japan has lately forced the pace, but the market that matters most remains US Treasuries — and despite Washington’s best efforts to suppress long yields, they are still rising. Either US policy rates rise further and/ or the dollar weakens.
Japan’s fiscal and debt strains are often blamed for bond market tensions. But the broader problem is simpler: World bond markets are adjusting to rapid nominal growth faster than policy frameworks can adapt. If trend NGDP has shifted higher, long yields must rise towards it — unless economies slow enough to drag nominal growth back down. Rising bond yields will challenge buoyant equity markets and hurt P/E multiples.
This note makes three points:
Nominal growth (NGDP) is pulling bond yields higher
US (and some other) policymakers are trying to suppress the adjustment through liquidity and issuance choices
Effects of yield suppression is likely to reappear through higher inflation, weaker currencies or higher short rates
The argument that follows is straightforward. Nominal economic growth sets the level for long yields; liquidity and issuance shape the term premium and slope; and when policymakers try to resist that adjustment, the pressure eventually reappears in currencies, money growth or short rates.
We are in a World where ageing populations, greater defence needs and pressures to mitigate popularism push fiscal spending ever higher. This, in turn, supports stronger NGDP growth, but the associated negative impact through rising interest costs presents challenges for central banks. They are suffering the same initial policy inertia as their Treasury colleagues, but ultimately they will be forced to act as market tensions build.
Central banks have broadly two choices. They can raise policy rates and try to slow NGDP, or they can push funding to the front end of the curve and accommodate it through money creation. The second route may buy time and it seems this is what the Warsh Fed intends, but such monetization usually ends with higher inflation pressure and, ultimately, much higher interest rates.
What Drives Bonds?
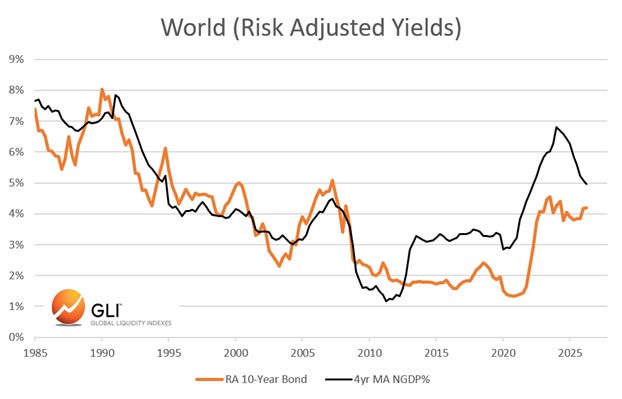
The central issue is the gap between trend nominal GDP growth and the yield available on longer dated government bonds. NGDP is not a mechanical fair-value model, but it links to the return on capital and long yields move around this axis. The following chart reports World NGDP growth against a weighted basket of risk-adjusted government bond yields. The two series track closely.
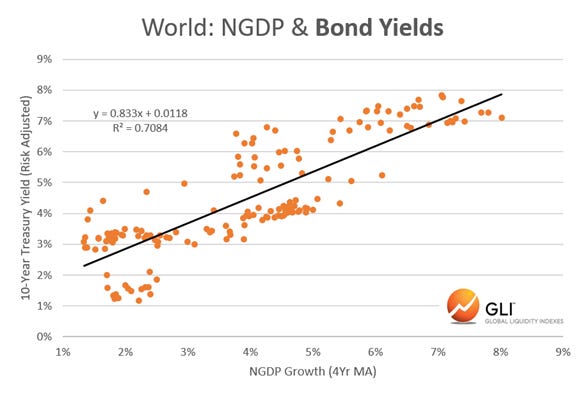
A second chart reports a scatterplot over the same period and shows that this relationship is both tight and robust. At 5% World NGDP growth global bond yields should average over 5%, or more than 100bp above prevailing levels. These gaps cannot persist indefinitely: economies must cool quickly or bond yields will have to rise further.
Yet, we seem to be entering a new paradigm of faster nominal World growth for the earlier cited reasons. Economists have been slow to appreciate the scale of the recent NGDP shift. The step-up is clearest in the US and Japan, where trend NGDP is running at roughly 7-8% and 4-5%, respectively — around 200bp above prevailing 10-year bond yields. But European economic data surprises are rising alongside, and China’s lacklustre economy may finally be stirring.
In summary, two things matter for bond markets:
Trend NGDP growth
Net liquidity conditions (including issuance)
The former drives the underlying level of yields. The latter shape term premia and, therefore, affect the slope of the curve. Put differently, if the long end is anchored by nominal growth, the front end is driven more by liquidity: the maturity profile of issuance, investors’ risk appetite and the ease of borrowing.
Three corollaries follow. First, long yields determine short rates, not the other way round. Second, inflation is more likely to flatten the curve than steepen it, because it drains liquidity from financial markets. Third, when policy makers suppress the term premium — as under yield-curve control (YCC) — yields can trade below NGDP for a time, but not indefinitely. These points sit uneasily with textbook models built around inflation, independent policy rates and fiscal deficits.
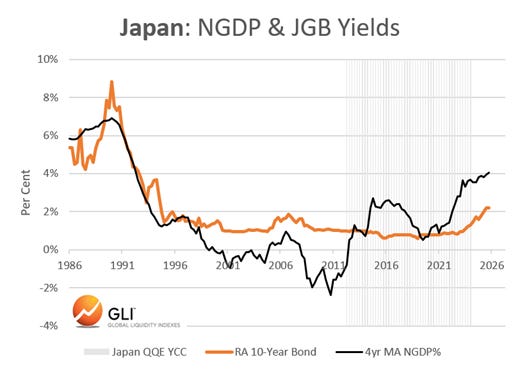
Japan illustrates the point. The chart below plots NGDP against risk-adjusted 10-year JGB yields, with the QQE/YCC policy era shaded. When YCC ended, JGB yields moved rapidly towards the faster trend in NGDP growth. Latest risk-adjusted yields stand around 2.2%, but with NGDP growth estimated near 4%, Japanese yields plausibly have a lot further to rise. The adjustment is on-going, and affecting the entire yield structure. Not surprisingly, if the Bank of Japan resists rate hikes by maintaining money market liquidity, the Yen must weaken.
What Does This Mean For US Treasuries?
Rising JGB yields arguably matter because Japan holds large amounts of US Treasuries. This is important, but it is not the main reason that US funding costs are rising. Again, the bigger force is US NGDP itself: powered by the AI capex boom and the huge fiscal deficit itself, the US economy is running hot. Indeed, the Atlanta Fed’s latest nowcast estimates that 3rd quarter GDP (real) running at a 5.8% clip.
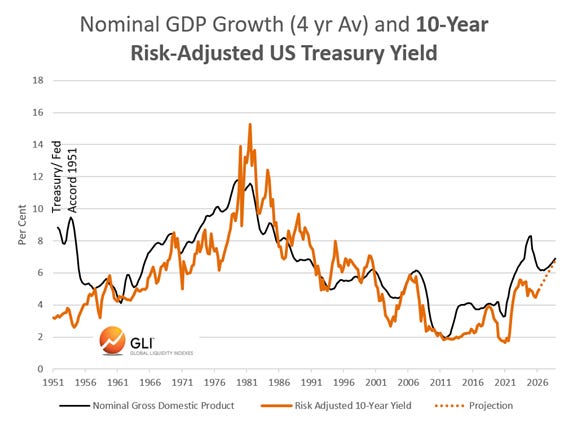
The chart below tracks US Treasury yields (risk adjusted to eliminate term premia and liquidity effects) against nominal GDP growth, using a 4-year moving average. A more detailed analysis (not shown) suggests that the inflation component of NGDP has a slightly higher loading than real growth. Nonetheless, this relationship still confirms the overall importance of NGDP growth.
The 1951 Treasury/ Fed Accord is annotated. This ended the war-time management of the bond market and allowed the Fed to steer an independent policy path. Not surprisingly, US Treasury yields then climbed towards the NGDP trend. It seems plain that US yields are again moving up to a higher level more consistent with the faster latest NGDP trend.
The Fiscal Math Is Changing
The fiscal deficit cooks its own lunch, because the resulting strong NGDP growth drives interest costs higher and further widens the deficit, so compounding the debt problem. Today’s governments, often under fire from popularist attack, are reluctant to rein in primary spending. More active government and more directed spending are also inevitable facets of what we generically term ‘Capital Wars’. The US has focused her efforts on containing China through tariffs, technology control, creating more robust supply chains, securing critical mineral supplies, strategic investment stakes and raising defence procurement. The bill grows.
Consider, other economies and how policies responded to recent higher oil prices with subsidies, not conservation. Throw in the latest German plans to release her debt brake for infrastructure and defence and add Japan’s similar intention, but with her additional tax cuts. France has long allowed her fiscal deficit to spiral higher, and even Britain is openly talking about fiscal flexibility.
More than 15 years ago and in the wake of the GFC, the G20 committed itself to fiscal consolidation. These proved empty words, because gross public debt to GDP is now some 15% points higher and rising. Not only is the G20 a collectively poorer policeman, but low interest rates seduced many governments to keep spending, while structural forces, like aging populations, and shocks, like the Ukraine invasion, Iran tensions and the China threat, added greater demands.
Admittedly, Washington is fighting the tape, helping to slow the US Treasury market’s adjustment. The Fed and Treasury have tried to suppress rising long term yields through a combination of policies that: (1) shift funding away from the long end and towards bills; (2) cap bond volatility to encourage leveraged investors to buy the now scarcer long dated issues, and (3) remove any resulting funding pressure at the short end by providing extra liquidity to money markets. At the last Fed presser, Chair Warsh explicitly emphasised the ‘ample bank reserve’ regime, i.e. liquid money markets, while the recent QRA repeated the pattern of greater bill finance and heightened Treasury buybacks to cap yield volatility.
We have dubbed this policy in the US ‘yield volatility control’ (YVC). Think of it as a shift in QE policy, but now directed by the Treasury and funded by the private sector, rather than as both previously by the Fed (i.e. Fed QE).
Other major economies are copying the financing math, evidenced by the shortening average tenor of their gross issuance. Funding at the short end is comparatively straightforward because, when fiscal policies are loose, banks have a near insatiable appetite for short dated government paper, which better duration matches their liabilities. However, spoiler alert: this is monetization. Experience shows this always ends badly. Policy makers will be found out from evidence of accelerating money supplies.
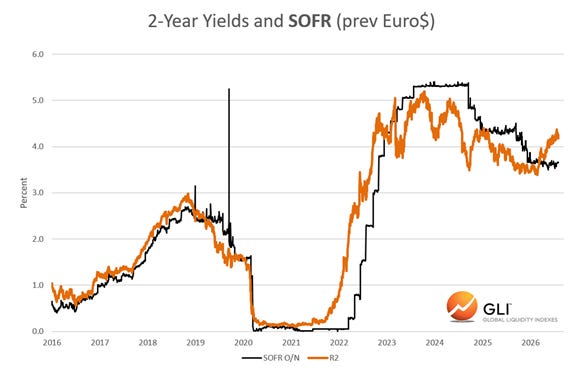
Governments won’t cut spending. Central banks won’t raise rates fast enough. These policies are like holding an inflated beach ball under water: temporary, unstable and liable to end with a whoosh. The more repo liquidity the Fed supplies, the more that bank balance sheets and money supply expand — and the greater the risk that NGDP and main-street inflation accelerate. That must add further upward pressure to bond yields. Already, US 2 year Treasury notes are pricing higher policy rates. An AI cross-check suggests that this has been a correct prediction around 85% of the time. See chart. Recall the long-end (orange line) drives the short-end of the rates market (black line), not vice versa. Higher policy rates are coming…
Disclaimer
The information is provided for information purposes only and on the basis that it will not be relied upon. No information contained herein constitutes a personal recommendation or investment advice.
The information (including any expressions of opinion or forecast) have been obtained from, or is based on, sources believed by the author to be reliable, but are not guaranteed as to their accuracy or completeness and should not be relied upon. The information is provided without obligation on the part of the author and on the understanding that any person who acts upon it or changes his investment position in reliance on it does so entirely at his own risk. The information does not constitute an offer to buy or sell or an invitation to make an offer to buy or sell any financial instrument.
Information is current only as at the date it is first posted and may no longer be true or complete when viewed by you. All information may be changed or amended without prior notice.
No representation, warranty or undertaking is given as to the accuracy or completeness of the information by the author and no liability is accepted by the author for the accuracy or completeness of such information. In no event will the author be liable to any person for any direct, indirect, special, or consequential damages arising out of any use of the information, including, without limitation, any lost profits.
You should be aware that the Internet is not a completely reliable transmission medium. The author does not accept any liability for any data transmission errors such as data loss or damage or alteration of any kind, including, but not limited to any direct, indirect or consequential damage, arising out of the use of the product or services referred to herein.
The materials provided here including text, photographs and other images, are protected by copyright and/or other intellectual property rights. All copyright (and any other intellectual property rights) in these materials is either owned by the author, or is used by the author under licence.
Hello Michael,
thank you very much for the article—it was a great read and, as always, thought-provoking.
What are your projections for the 10-year US Treasury yield, the federal funds rate, and core inflation in the US a year from now?
Brilliant.