Will the hot US dollar ever cool-off? Despite soaring gold and cryptocurrency prices, the US dollar as measured by the trade-weighted index (DXY) keeps moving higher against peer units like the Yen, Yuan and Euro. Evidence the trend rise in the real trade-weighted dollar index:
What’s more, as the next chart confirms, foreign capital seems forever being sucked into US assets. This has been both unambiguous and sizeable since the 2008/08 Global Financial Crisis (GFC).
Brent Johnson of Santiago Capital explains this. He describes an international financial system characterized by vast pools of Global Liquidity (we agree!), which he likens to a "milkshake". These pools are periodically ‘sucked up’ into America through two straws: the first labelled ‘higher returns’ and the ‘acknowledged stability and safety of the US financial system’, the second. Despite facing recognized economic challenges, America’s economy remains the ‘cleanest grubby shirt in the laundry’ among its international peers. This allows the US dollar to remain strong and serve as a haven for World money.
The Imperial Dollar
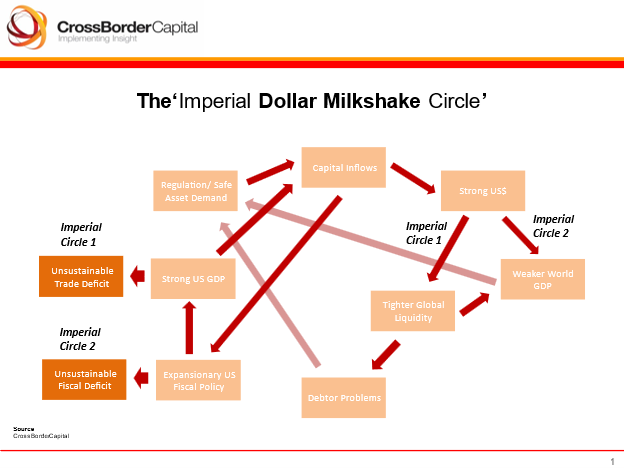
Turns out that the Milkshake theory is a more colorful and up-to-date version of George Soros’ 1984 Imperial Circle. The core of both arguments is that the US economy is getting smaller relative to the Rest of the World, while the World’s use of US dollars as the international standard of value continues to get bigger and bigger. This creates a positive feedback loop that generates overshooting cycles. We wrote about this fact in the book Capital Wars (Palgrave, 2020).
Soros specifically focused on the impact of the swelling fiscal deficit on the US economy, arguing that the resulting high interest rates were not only magnets for foreign capital, but these capital inflows, in turn, fed and perpetuated the boom. Sound familiar?
“The budget deficit is not deliberate. It is the unintended consequence of irreconcilable policy objectives: a desire to cut public spending while maintaining a strong military posture and reducing taxation. When government spending could not be cut sufficiently the deficit soared….
The budget deficit keeps interest rates higher than they would be otherwise. High interest rates coupled with financial deregulations suck in funds from all over the world, political considerations also play a part: a strong defence posture in a world fraught with conflicts tends to attract foreign capital.” (George Soros, FT, May 23rd 1984).
This virtuous circle for the US (dubbed ‘Imperial’ because Soros argued America was subjugating Emerging Market dollar borrowers) was likely to inflate a bubble that would ultimately be punctured once foreign investors recoiled at the prospect of financing the resulting huge trade deficit:
“The budget deficit stimulates the economy. Without it, the recovery could not have been as fast and vigorous as it turned out to be. The recovery, combined with high interest rates and the influx of foreign capital, tends to keep the dollar strong. The recovery, combined with a high exchange rate, tends to suck in imports and create a trade deficit. The trade deficit combined with a high exchange rate tends to moderate inflation, as a consequence, the U.S. enjoys the best of all possible worlds: strong economic growth combined with low inflation and budget deficit financed by the influx of foreign goods and foreign capital.
“When capital inflows cease to exceed the new rising trade deficit, the dollar will decline and the Imperial Circle will be turned upside down. With foreign capital seeking refuge elsewhere even a shrinking budget deficit will be more difficult to finance. With the dollar weakening, interest rates and the rate of inflation may rise when it ought to be falling.” (George Soros, FT, May 23rd 1984).
Four decades ago, in addition to an unfinancable trade deficit, Soros also feared that defaults by foreign dollar borrowers would spike the dollar’s rise by threatening the solvency US banks:
“The U.S. budget deficit is the last remaining engine of inflation in the world; if it is reduced, deflationary forces will predominate and the world economy is going to crash. The heavily indebted countries will be unwilling and unable to pay their debt. …[They] may choose to stimulate their domestic economy rather than service their foreign obligations.
“The tension between the collective of commercial banks and the debtor countries is also likely to reach a climax …[T]he banks’ commitments far exceed their own resources. Any viable arrangement [to resolve these tensions] will require some additional commitments from the industrialized nations both to underwrite the banks and to ensure a flow of new lending.” (George Soros, FT, May 23rd 1984).
In the event, G5 policy makers met to forestall a crisis and hammered out the 1985 Plaza Accord, designed to bring down the runaway dollar. It worked! Some would argue too well, because the subsequent 1987 Louvre Accord was forced through to brake the skidding dollar.
Real Exchange Rate Adjustment and Asset Markets
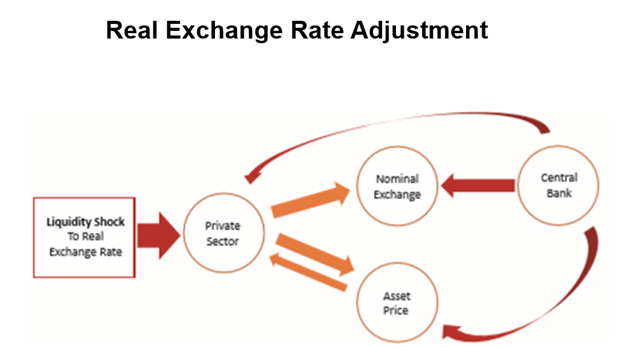
The heightened momentum of capital is plainly something to consider, but another is how markets and economies adjust to these flows. In practice, real exchange rates are the main vectors promoting economic adjustment. The real exchange rate is defined as the nominal exchange rate adjusted multiplicatively by an index of high street prices, wages, and asset prices. These adjustments can be slow and drawn out. In practice, wages and high street prices tend to be ‘sticky’ or slower moving than asset prices. Hence, asset markets carry the bulk of the adjustment burden in modern economies. It follows that if sufficient pressure builds and this is channeled through financial markets, it can result in both to sudden asset price booms and, at other times, sharp financial crises.
This mechanism – described in the flow diagram – helps to explain why asset prices and currencies often correlate closely. Evidence the out-performance of Wall Street and the rise in the US dollar, and the similar run-up in the Tokyo stock market and the Yen during the 1980s.
As new capital enters the private sector it boosts the real exchange rate. This involves some combination of a rise in the nominal exchange rate and a rise in asset prices. The split is controlled by the domestic Central Bank. Adding more liquidity to keep down a rising exchange rates will further fuel an asset price rally. Similarly, tightening to protect a falling exchange rate will cause asset markets to crash.
Typically, policy makers fight against exchange rate strength by easing and, initially at least, they will tighten policy to support a failing currency. Hence, if real exchange rates need to move, but high street prices and wages prove ‘sticky’ and policy makers actively manage exchange rates, then asset markets are forced to take on the bulk of the adjustment burden.
Crisis risks are heightened when policy makers are reluctant to let their nominal exchange rates move up or down sufficiently. In this light, consider the policy responses of Japan and Scandinavia in the early 1990s; Emerging Asia in the mid-1900s and China in the post-GFC period. They all tell us why watching the US dollar is so critical.
The World in 2024
Today, the World looks somewhat different to the Imperial Dollar era. The US has become less dependent on foreign oil, and indeed has turned into a net energy exporter. Hence, America’s trade deficit is not the bogey is was in the 1980s. Moreover, while the World’s dollar borrowings are sizeable, the Emerging Market debt problem has become less acute and, moreover, does not involve traditional banks to the same extent that it did in the early-1980s.
Yet, common to both views is that large-scale capital inflows into the US force the dollar higher. In fact, as the following chart shows, the scale of recent capital inflows into US assets have even bested the hefty inflows enjoyed during the 1980s, when measured relative to Global Liquidity.
In addition, there is a second-round effect since the stronger dollar then makes the US even more attractive to foreign money, whether because of some absolute improvement in US economic conditions, or because of a corresponding absolute deterioration in economic conditions elsewhere. Think of this hybrid as the ‘Imperial Dollar Milkshake Circle’. The following flow diagram traces out the linkages. We have labelled likely adjustment paths as ‘Imperial Circle I’ and ‘Imperial Circle II’. It seems to us that the second out-turn involving an extreme fiscal challenge, rather than a rising trade deficit, is more likely today.
Looking ahead, the spiraling size of the US Federal deficit and the runaway growth of US Treasury debt could knock support away from the US dollar. We have previously argued that with rising defense outlays (echoing concerns from the 1980s) and with mandatory spending commitments for Medicare and social security that are largely set-in-stone, America’s debt burden looks formidable.
Evidence the slide below which projects future US public debt growth, based largely on bipartisan Congressional Budget Office data (CBO) with a layer of extra defense outlays. According to the math, the US public debt/ GDP ratio is slated to hit a whopping 225% by 2050, while annual debt increases exceed 15% of future GDP!
Without the ability to sell debt widely to foreign investors, the US authorities will be compelled to sell debt domestically and, probably, they will be forced to sell shorter-dated debt to thirsty credit providers, including high street banks and the Federal Reserve. This would represent pure ‘monetization’ and promises a future monetary inflation that could serious undermine the integrity of the dollar. Is this what the soaring gold price is already warning? Watch carefully. We are not forecasting a weaker paper dollar, but we must acknowledge that, in the late-1980s, its rapid fall was better remembered than its previous steady climb.


Hi Alex
May be what I wrote was not so clear. The argument is that real exchange rate has two moving parts - nominal and asset prices. Both can move. If the nominal take all the adjustment then assets prices are unchanged. If not then asset prices move. Now the USD and asset prices are sharing the adjustment, which suggests a near-neutral Fed policy. If the Fed eases, asset prices will adjust by more.
Consider the cases of Japan 1980s Asia 1990s and China 2019s. Here capital came in, real exchange rate moved up and adjustment largely in asset prices as Central Banks eased.
So the adjustment is not either/or but can be both depending on policy response.
A Yen carry trade is possible but after such a large fall it would be nuts. These positions are usually very sensitive to volatility.