


The Debt/ Liquidity Spiral (Part 2)
‘Monetary Inflation’ Is More Important To Understand Than ‘Financial Repression’

Financial crises are fundamentally debt-refinancing crises, driven by liquidity shortages amid ever-growing debt piles. Our analysis identifies a 5-6 year cycle in Global Liquidity, tied to debt maturity rollovers, where refinancing pressures dictate market stability—not traditional metrics like debt/GDP. Monetary inflation (liquidity growth and devaluations of paper monies) matters more than financial repression, as it preserves real wealth (via assets like gold and Bitcoin) rather than just incomes.
Public debt is expanding faster than private debt, fueled by welfare commitments and rising interest burdens, ensuring persistent liquidity growth. Since debt both backs and demands liquidity, and liquidity drives asset prices, gold (up over 12x since year 2000) and Bitcoin, both besting Treasury debt growth, serve as pure monetary inflation hedges, outperforming consumer-price inflation due to structural cost deflation.
Projecting ahead, liquidity will grow 3-4% faster than GDP, sustaining asset bubbles while worsening wealth inequality (as non-asset holders fall behind). Attempts to suppress gold prices or stabilize debt growth risk monetary squeezes and financial crises. The system’s underlying flaw is its bias towards debt refinancing over productive capital allocation. This threatens to entrench financial instability unless it can be reversed.
We conclude that the consequences of the debt-liquidity spiral demands a shift from refinancing-driven markets to growth-focused capital raising activity, before political and economic fractures escalate.
The Argument
“The ultimate cause of all financial crises always remains the lack of liquidity as compared to the tendency of modern credit systems to over-accumulate debt. Crises are always and everywhere, debt re-financing crises. In other words, they concern the inability to roll-over our huge piles of debt.” Part 1, The Debt-Liquidity Spiral
In Part 1 of The Debt/ Liquidity Spiral (https://capitalwars.substack.com/p/the-debt-liquidity-spiral?r=1nnkxi) we argued that debt is issued with term and needs to be periodically refinanced. When debts cannot be rolled, financial crises break out. Equally, times of excess liquidity can lead to asset market bubbles. In short, changes in the pace of this refinancing process helps to explain the 5-6 year (65 months) cycle in Global Liquidity, which fluctuates with a frequency similar to the average maturity of World debt.
The timing of this cycle, established from the data using Fourier analysis, resonates with a frequency similar to the average maturity of World debt. In other words, it represents the cycle of debt re-financing. We noted in an earlier report how a thorough independent analysis by Lars von Thienen from The Foundation for the Study of Cycles (Cycles.org) confirmed our original findings, even added a second important cycle frequency at 76 months (6.3 years).
Cycles.org have posted our recent interview on their YouTube channel:
If debt influences the liquidity cycle, this suggests that the appropriate metric for investors to monitor is not the nebulous debt/ GDP ratio, which unhelpfully seems to trend ever higher, but the relationship between debts coming due and liquidity, ie. the effective debt/ liquidity ratio, which is typically a stationary, mean-reverting data series and signals financing tensions. A corollary is that the prescription of financial repression associated with maintaining a low debt/ GDP through a low interest rate and high nominal growth rate, although useful, is less important than many claim. What matters is monetary inflation, not financial repression. In short, we should be worried about preserving real wealth levels more than maintaining real incomes.
We anyway question the proposition that if policy makers really are able to set market interest rates and target nominal GDP, why don’t they always do it? The reality is that the market decides these things, and when governments try to suppress interest rates they simply end up encouraging the take-up of even more debt.
Future Debt Growth
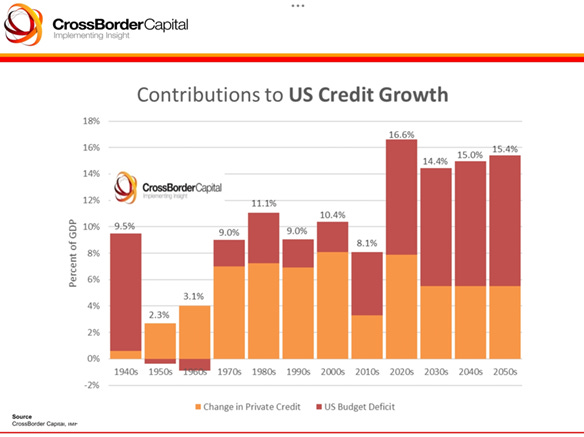
We focused on the crisis cycle in Part 1 rather than the implication of the long-term trends in debt. However, turning to these trends, we noted that public debts are growing noticeably faster than private debts, given the commitment to mandatory welfare spending undertaken by the Western economies. This tends to lead to faster liquidity growth, because public debt is more easily monetized. The growth of public debt and liquidity are also dominated by the interest bill and by changes in the average duration of debt. The sizes of primary budget deficits are important, but they are not a necessary condition for rapid debt growth. Indeed, with the persistent expansion of the absolute stock of debt, the interest bill is fast becoming a critical line item in the government budget.
When liquidity growth exceeds debt growth, asset prices tend to be among the first categories to respond. The most consistent asset bellwether over time is the price of gold, although lately Bitcoin also proves to be highly sensitive to monetary inflation. Put another way, the gold price is linked with the pace of future debt growth. Evidence how in the quarter century from Year 2000, the stock of marketable US Treasury debt grew to US$28.7 trillion from US$2.95 trillion, a whopping 9.7-fold rise. Over the same period, gold prices are up from US$273/ oz or by a bigger 12.6 times. Coincident or not?
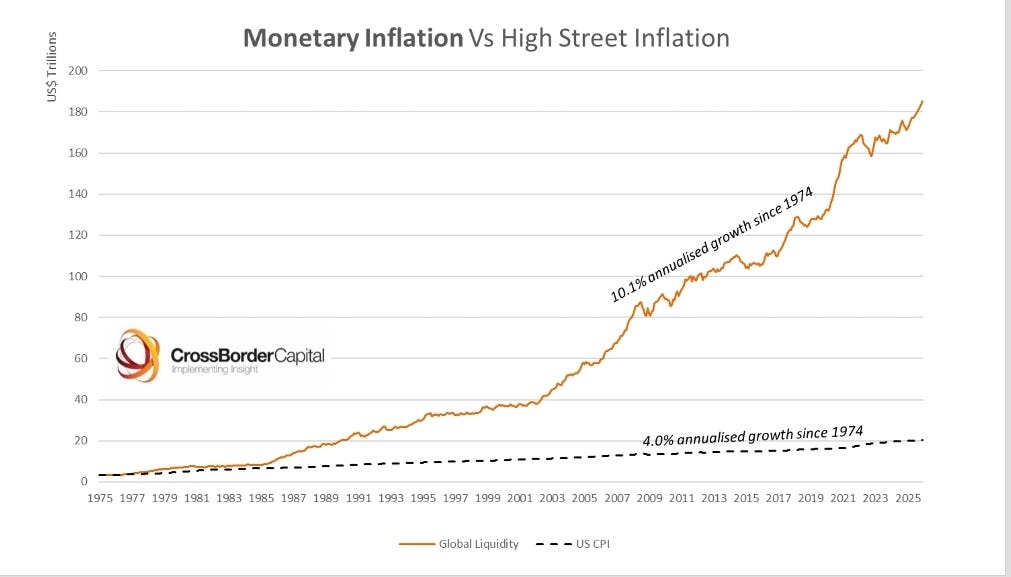
High street prices are affected both by this monetary debasement of paper currencies and by the impact of cost and productivity effects in the real economy. Monetary inflation is not the same thing as high street inflation, but a component and one whose impact on the consumer price level is suppressed by cost deflation. See chart. Monetary inflation has exceeded a 10% annual clip since 1974, or two-and-a-half times to pace of reported high street inflation.
We reserve the prefix ‘monetary’ for changes in the value of paper monies to distinguish them from high street inflations and deflations, which are frequently cost-based. The gold price itself often provides an accurate gauge of monetary debasement, or as we prefer to say, monetary inflation, because the physical gold market is frequently in balance without excessive demand or supply pushing up physical bullion prices. Admittedly, in the last few years, heavy gold buying by China, Russia and other nations has separately boosted demand for physical gold and so biased this signal upwards. On top, some allowance must be made for liquidity to circulate in the financial economy to facilitate required debt roll-overs.
Expressing this mathematically, the increase in gold prices measured in, say, US dollars, is roughly equal to the rate of US price inflation, plus general productivity gains less the rate of increase in gold supply, plus the growth in financial sector liquidity. For financial stability, we argued in Part 1 that the ratio between debt and liquidity should be constant, meaning that both need to grow together. The paradox of modern finance is that debts of different stripes are the collateral backing for liquidity provision, but debt themselves need liquidity for their refinancing.
Gold prices, debt levels and the size of the liquidity pool triangulate, because debts drive liquidity and liquidity drives the gold price. So, given the future pathway of debt issuance, how much future liquidity growth is likely and how will gold respond?
Looking back, there have been three key stages in the monetary inflation process: (1) the acceleration of debt in general following China’s 2001 entry into WTO which destroyed the profitability of Western capital; (2) the more rapid growth in public debt after the 2008/09 GFC when it became clear that the private struggled under its burden, and (3) the increasing monetization of public debt since the 2020 COVID emergency.

Taking America as a benchmark, let us assume that private debt grows at a 5% per annum trend increase in line with NGDP. Alongside, US public debt is slated to grow at a faster underlying 7-9% annual pace, given interest rates likely settling around 4-5% across the term structure; budget deficits, given rising mandatory outlays, running on at 3-5% of GDP (equivalent to a 3-4% increase in the stock of outstanding debt). Indeed, mandatory outlays plus defense and interest payments are set to grow at least 2-3% faster than overall government spending. Hence, total US debt is projected to climb at a 7-8% annual rate, or around 2-3% quicker than NGDP.
Monetary Inflation Hedges
This is the minimum growth rate that underpins Global Liquidity expansion, with a slightly more rapid clip of, say, 9-10% more probable whenever Treasury funding problems arise and force reductions in debt maturity, i.e. greater monetization. Think of this rate of monetary inflation as the cost of financial stability.
This would mean that Global Liquidity grows around 3-4% faster than World NGDP, so driving up the Liquidity/GDP ratio and allowing asset markets generally to trend higher. In turn, assuming 2% annual consumer price inflation and an increase in gold supply roughly matching the 2-3% annual gain in overall national productivity, this also implies a slightly stronger 8-10% annual future trend increases in gold bullion prices.
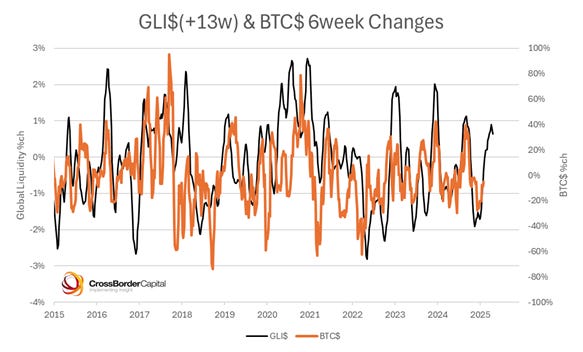
The chart below tracks the long-term historical movements between Global Liquidity and a basket of monetary inflation hedges, namely gold and Bitcoin. In the past both correlated closely. The chart also reports the slower path of consumer prices (i.e. high street inflation) as the lower broken line. Monetary inflation has historically surpassed high street inflation, because of secular cost deflation, courtesy of technology gains and cheap Chinese imports. It confirms that gold and Bitcoin are, first-and-foremost, monetary inflation, rather than high street inflation hedges.

Importantly, the pace of monetary inflation represents the ‘true’ hurdle rate for investors, not the policy interest rate set by the US Fed, because it is this growth rate that maintains overall purchasing power in our credit money systems. But which assets are likely to generate these annual returns? Not cash, not bonds, possibly the stocks of large firms with pricing power, and potentially innovative technology companies, but most probably gold and proven monetary inflation hedges. Bitcoin is a more recent addition, but as the data below seemingly confirms, since 2015 it has moved tightly with prior gyrations in Global Liquidity.
Historically, the assets most sensitive to rising liquidity and specifically rising Global Liquidity are shown below in the chart of latest regression results:

It also follows from the analysis that a backdrop of strong debt growth is incompatible with a stable gold price. Therefore, therefore any attempts by policy makers to fix the level of the gold price (as we argue the Greenspan Fed previously did informally in the mid-1990s) would be wrong-headed until debt growth itself can be contained. Otherwise, this could lead to a severe monetary squeeze and possible financial crisis. However, we acknowledge that this is in many ways a chicken-and-egg problem.
Note also that the choice of a gold price target determines the distribution of wealth between debtors and creditors, and between asset holders and non-asset holders. Monetary inflation helps debtors, while monetary deflation benefits creditors. When Central Banks ease policy to target gold above the prevailing bullion price they will generate a monetary inflation until the target is met. This will lift asset prices generally and may also partially spill-over into high street inflation. We have argued in recent reports how China may herself be secretly targeting a RMB26,000/ oz gold price to ease the Chinese economy out of debt deflation.
Rising gold prices and, hence rising asset markets, reinforce the financial nihilism we discussed in Part 1. The paradox here is that the more money that is committed to, say, government welfare spending to bolster the incomes of the less wealthy, the more that these ‘non-asset owners’ are further disenfranchised by faster monetary inflation. This seemingly immutable law needs to be cracked by finding ways other than liquidity and debt to finance government spending. Higher taxes on the productive classes are not the answer either. What is needed is investment for growth, otherwise the underclass problem in modern economies is likely to get far, far bigger with damming political consequences.
Part 1 argued how financial markets today serve as giant debt refinancing mechanisms and not as the new capital raising vehicles popular in finance textbooks. Today, balance sheet capacity, i.e. liquidity, is what matters. Ironically, interest rates have become a cost for government and a source of income and stimulus for the private sector. We need to turn back to a World where capital markets focus less on debt refinancing and more on raising new capital for growth.
Michael thank you for your excellent, thought provoking analysis. Could I ask a couple of questions re current year playbook. In my mind we have macro shocks with tariffs, DOGE, wars; we have the refinancing wall in the US and elsewhere, with the prospect of normalising issuance across the curve and so reducing liquidity through less shorter term bill issuances and finally, I think, we have further bond vigilante revolt as the Trump tax cuts are extended, increasing the deficit even more in spite of DOGE AND Tariffs (which end up being more political stunts than substance) against a backdrop of insufficient liquidity.
Two questions:
i) do you agree with these factors and are there others you would add; and
ii) in terms of path to higher liquidity, my fear is we are sleep walking into financial heart attack in the system; and sufficient liquidity will only arrive after it has started and not before to avert the crisis? Does this accord with your views and if so, do you have a sense on timing in terms of the path to higher liquidity? My thought/fear is we have a rally for a few weeks with good news on tariffs, then people realise the forward deficit with tax cuts will not remotely be covered by higher revenues from tariffs and less costs from DOGE, and we have a spike in yields which the fed and treasury can’t just talk their way out of which trump managed to do earlier this month, until they anonounce tangible action.
Thank you
Hi Michael, according to your Asset Allocation Traffic Lights, which phase are we currently in? I believe we are in the Speculation phase. I’m not sure if this is an appropriate time to invest in risk assets, and I’m also not sure what the orange color represents. It would be helpful if you could provide a monthly update on this.