Latest US Federal Reserve balance sheet data report a modest downtick, but we stick by our view that the Fed is undertaking a more general “Stealth QE” (see newsletter 14th June ‘Stealth’ QE At The Fed?!).
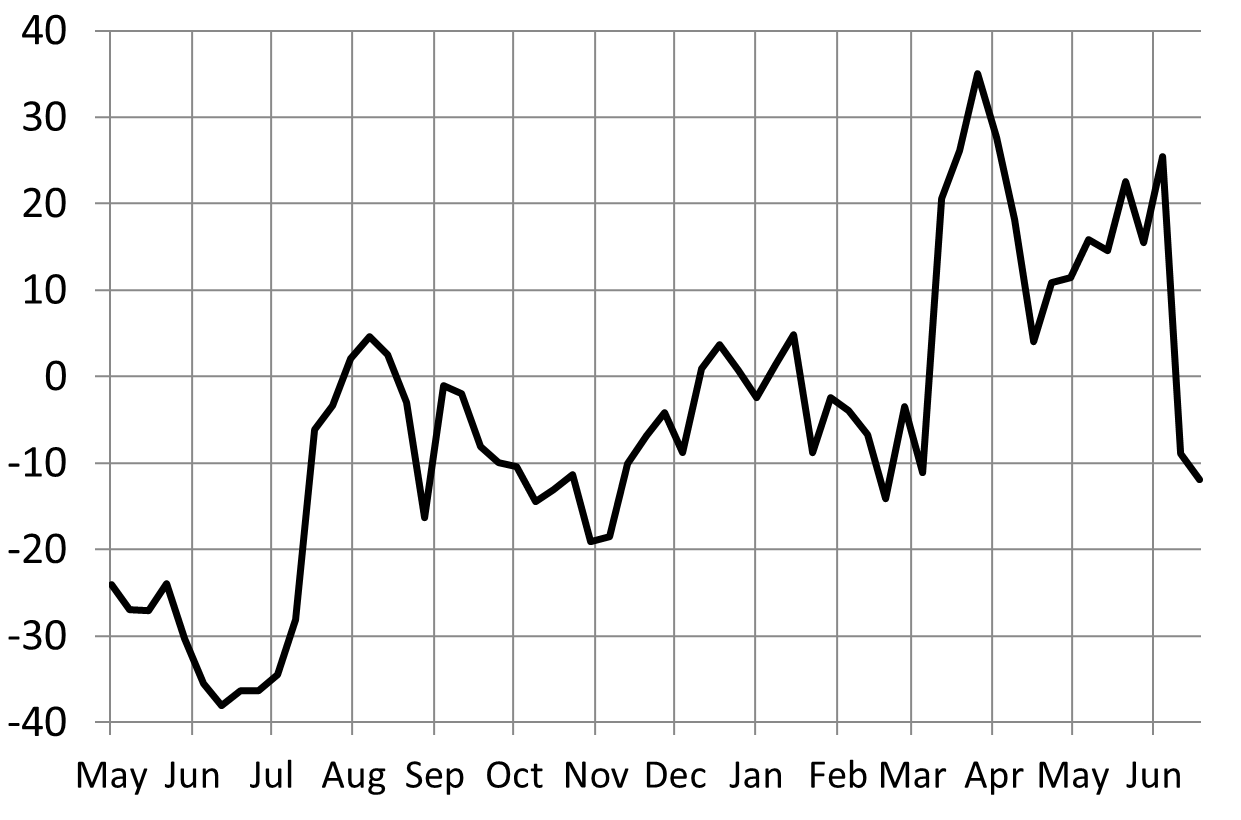
The chart below shows the 3-month annualised growth rate of net Fed liquidity injections. The trend remains up, but there has been a clear slowdown in the last two weeks. This is largely a base effect. The 3m reference period looks back to mid-March when Fed liquidity jumped higher in response to the regional banks’ crisis. This saw Fed liquidity soar to US$5.69tr. As the chart below evidences, liquidity growth peaked at over 30% (3m ann.) at that time and remained at high levels for a month. So, we should expect this base effect to continue to have an impact for a few weeks.


