Following our previous discussion of China and her need for a ‘deal’ with the US (see Prospects For A Puzzling 2025, Part 1), we continue our look into 2025 by examining what is going on at the US Fed and the US Treasury. What could it mean for Global Liquidity? As background we reproduce, the opening chart from Part 1. This shows the disturbing dive in World GDP growth through December based on our daily estimates from an AI-based model. Does it reflect the recent tightening of Chinese liquidity that we noted in Part 1? Or does it derive from the fading ‘not-QE, QE’ and ‘not-YCC, YCC’ hidden US stimulus, now the Election is over (see below)?
Can the ‘Secret’ US Policy Ease Continue?
The US bond market is moving opposite to these latest economic trends and moving opposite to China’s crashing bond yields. The next chart is constructed from term structure data, not Fed funds futures, and because it looks at ‘risk adjusted’ policy rates it will be biased upwards. Nonetheless, it does show how expectations of rate cuts over the next 12 months have slumped despite the obvious roll-over in the pace of US GDP, according to our daily nowcast estimates.
Something else is plainly going on in order to keep policy rates ‘sticky’ and to drive term premia higher. We signaled several times in 2024 that US (and global) bond term premia are rising, likely under pressure of expanding debt issuance. Put another way, ever since the September 2022 Truss Budget debacle in the UK (where gilt yields spiked at one stage by almost 200bp), we fear that the celebrated Bond Vigilantes are back. In short, policy makers risk losing control of their national bond markets. Note how the impact is all one-sided: a bad bond market can lead to a bad stock market, but the reverse is rarely true.
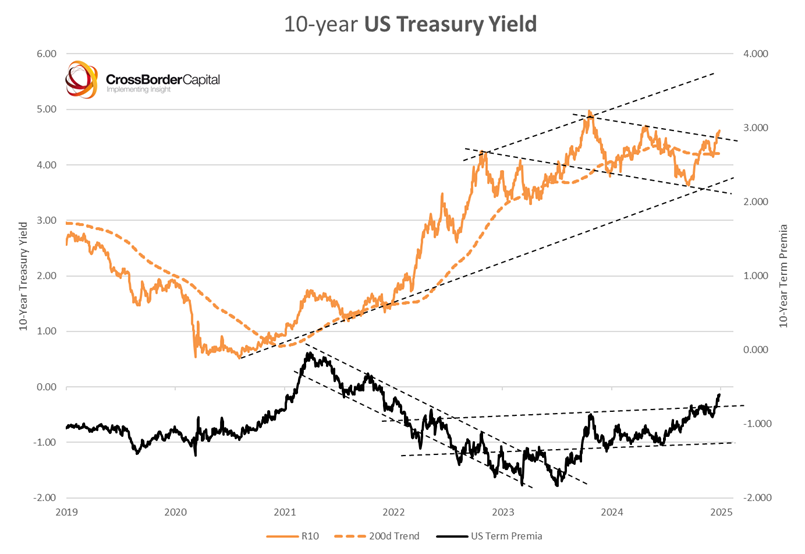
Consider, the following chart which shows the 10-year US Treasury yield against the implied term premia. It confirms both the upward break-out in yields and the more worrying rising upward trend in term premia. If yield momentum continues, US 10-year yields are on a collision-course to test 5.5% yields. In fact, a ‘fair value’ calculation derived from boot-strapping equivalent Agency mortgage yields points to a similar 5.4% figure. The current short-fall in Treasury yields can be explained by the recent heavy reliance on bill finance and a similar skew in the issuance calendar towards short-maturity notes. We have previously dubbed this policy ‘not-YCC, YCC’ (Yield curve control). It imparted a sizeable liquidity boost to US markets in 2023-24 by reducing the average duration of outstanding debt. But its effect is now subsiding. Note that we can define ‘liquidity’ ≈ assets/ duration.
The precise trade-off is evidenced below. This records the bias of Treasury yield suppression against the growth of Treasury bill finance. Heavy bill issuance creates a scarcity of coupon bonds and so raises their prices (reduces yields). As bill issuance subsides so this yield bias should close as Treasury yields rise back towards ‘fair value’.
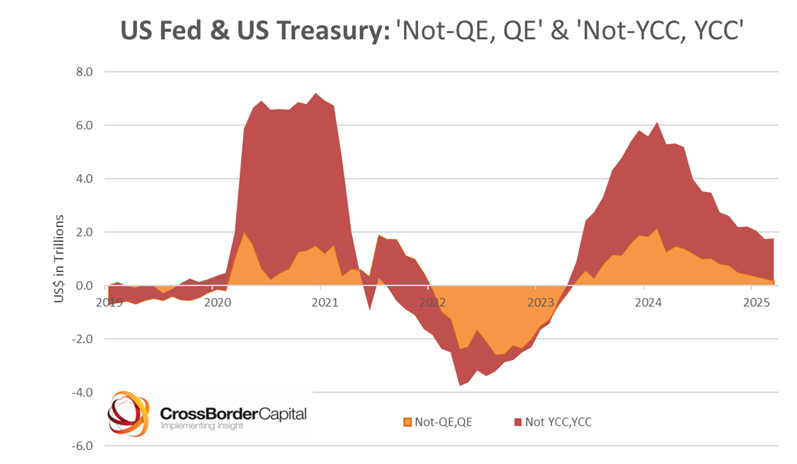
On top of this ‘not-YCC, YCC’ hidden stimulus from the US Treasury there has been an equivalent ‘not-QE, QE’ operated by the US Fed. Far be it for us to mischievously conjecture that Treasury Secretary Janet Yellen and Fair Chair Jay Powell deliberated oversaw these policies to goose markets ahead of the November 2024 Elections. Yet, the ‘not-QE, QE’ policy, which was channeled through the Bank Term Funding Program (BTFP), the Reverse Repo Facility (RRP) and the Treasury General Account (TGA) added sizable net money market liquidity despite the US Fed’s on-going QT (Quantitative Tightening) policy. The next chart records our estimates of ‘not-QE, QE’ are currently running at around a cumulative net stimulus of some US$2 trillion since the mid-2022 low.
The chart below shows the liquidity impact from adding together these effects (‘not-QE, QE’ and ‘not-YCC, YCC’). Note how this hidden boost excludes explicit QE and fiscal programs. These add additional stimulus. At their recent peak in early 2024, the two hidden boosts totaled a whopping US$6 trillion, or some 15% of total US Liquidity and mostly coming via financial markets. Little wonder that the S&P500 shot higher.
Looking ahead, the problem for investors in 2025 is that both these temporary or pre-Election boosts are now fading. The year-over-year impact has lately slumped from US$6 trillion to just under US$2 trillion and looks set to fall further. The Fed’s BTFP, a hangover from the March 2023 SVB Crisis, is largely spent, and, aside from a likely year-end spike, the domestic slice of the RRP is almost completely drained. Admittedly, there remains some US$800 billion in the TGA, but although this will be run off through the delicate debt ceiling negotiations in early-2025, it will likely be rebuilt thereafter to circa US$500-600 billion. In other words, unless a formal QE soon re-starts, the Fed may have only some US$250 billion of effective fire-power left.
In a taste of what may be coming, the final days of 2024 saw a flurry spikes in US repo markets, but somewhat more than usually suffered at year-ends. Fed Liquidity tightened sharply with banks’ reserves plunging to US$2.89 trillion or well-below the US$3.25 trillion level we estimate is their minimum operating bound. Arguably, this may prove a one-off air-pocket triggered by the end-year window-dressing of banks’ balance sheets since the reverse repo facility (RRP) see-sawed between US$474 billion and US$238 billion. However, put into broader context, money markets are tightening evidenced by the fact that some 85% of all spikes in the SOFR-Fed funds spread during 2024 occurred since last July. The chart below evidences the changing backdrop.
Tightness in repo markets is conditioned by poor Fed Liquidity and by bank reserves that are brushing the lower bound of ‘adequacy’, as shown in the following chart. Projections to mid-2025 are shown. This may not be outright ‘bearish’ news, but it is a long way from being viewed bullishly. Our concern is that Fed policy makers are leaning too much towards ‘cosmetic’ policy rate cuts, possibly swayed by political developments, while simultaneously ignoring the liquidity needs of markets. They may even foolishly be trying to balance lower policy rates with tighter liquidity. Indeed, the rhetoric from policy makers seems to worry more about the size of the Fed balance sheet compared to history, than compared to the size of the future debt refinancing challenge.
Remember how Janet Yellen has left a large and unfavorable legacy for new Treasury Secretary Scott Bessent with over 22% of US Treasury debt now outstanding in bill form. This comes on top of the approaching private sector debt ‘maturity wall’. Against this backdrop, Bessent will have to refinance some 30% of the US$28 trillion of US marketable public debt in 2025. He has vowed to shift maturities away from bills. However, this will drain precious liquidity and it remains to be seen whether he can do this without disrupting Wall Street.
Conclusion (Parts 1 and 2): More Liquidity, But Not Yet Enough?
The Global Liquidity outlook for 2025 more than ever rests in the lap of US policy makers. China badly needs to monetize out of her debt problem, but despite the latest dip, she, so far, shows no inclination to allow the Yuan to weaken sufficiently. In other words, China will need a similar policy easing from the US as cover. It is unclear why it would be in America’s interest to do this, except as part of some grand ‘deal’, and such deals take time.
Simultaneously, prevailing US policy initiatives are running out of steam. The heralded impact of DOGE is unlikely to substantially reduce the fiscal deficit, at least in the short term. New Treasury Secretary Bessent is against too much bill finance, but any shift towards more coupon issuance will absorb precious liquidity and impair financial balance sheet capacity, so threatening this bull market and annoying President Trump.
The Fed seems caught in the headlights and unable or unwilling to expand its balance sheet. Chair Powell has been flatly criticized by the incoming Administration for both operating a specific pro-Biden policy and generally being too soft on inflation. The fact that the Fed has become silent on its future balance sheet plans disturbs us. US money markets are tightening, as we have evidenced.
Assuming the US Treasury operates a neutral ‘liquidity’ policy going forward and projecting the Fed balance sheet out into 2025, using the existing policy framework, produces a disappointing circa 5% growth in both Fed Liquidity and the ‘broad’ US dollar Monetary Base, which includes US dollar forex reserves of foreign Central Banks. This, of course, may prove to be a floor, not a ceiling, but it still looks lackluster. What’s more, we know that a strong US currency is often a ‘wrecking ball’ for international markets. Given the historic importance of the US Fed and the US dollar for Global Liquidity, as shown in the chart below, 2025 is not 2024. It may prove a more challenging year than many expect
.


A potential solution could involve the Fed implementing QE by purchasing long-term Treasuries to inject liquidity, stabilize markets, and facilitate debt refinancing. However, with the Fed currently focused on inflation concerns, it may take significant market turmoil or corrections to prompt a shift toward prioritizing liquidity support. Would you agree with this view?
Thank you for your continued deep-dive analysis, Michael. I’d like to share some of my thoughts, which might offer additional points for deeper consideration:
I. The FED/Treasury’s goal seems clear:
A) Capitalizing on the excess confidence in U.S. markets to withdraw as much liquidity as possible, ultimately bringing bond yields down—a coming non-QT QT?
B) Dropping interest rates and financing with bills to avoid the interest rate trap—the ongoing non-YC YC.
The key question is: between A) and B), which will take precedence in determining the path of liquidity?
II. A potential U.S.-China deal
I believe we’re awaiting a U.S.-China agreement that could spark the much-anticipated commodity bull market. However, I see the ideal timing for this deal as being closer to the next U.S. election—likely no earlier than 2027. This timing would allow the real economy to strengthen gradually ahead of late 2028, avoiding overheating or inflationary pressures during 2028.
That said, we might see a sham easing before that, designed to calm bearish sentiment during the recession. There’s the possibility of another Chinese “Bazooka” fake intervention to manage the economic narrative.
Gold prices in the interim:
In the meantime, gold prices could actually decline. Perhaps we might see levels around $2,400—or even as low as $2,150?