


Mapping Out The Liquidity Cycle ... and Bitcoin
A Collaboration with The Bitcoin Layer


Dear Readers,

This article is a unique collaboration with The Bitcoin Layer. It will be followed up by a Live Q&A for paid subscribers in the following days. See separate announcement. This piece is structured, as follows:
The CrossBorder Capital team reviews how today’s liquidity setup emerged.
They also introduce the Debt-Liquidity Nexus and its role in the ‘Roaring 2020s.’
The Bitcoin Layer examines historical trends in collateral assets, bond volatility, and SOFR spreads.
And finally, we conclude with our outlook for the decade’s end.
So, without further ado, let’s dive into the analysis.
Money matters, credit counts, but liquidity leads
Should we be positioned ‘Risk On’ or ‘Risk Off’? It seems that what all investors need to know these days is whether the Global Liquidity tap is turned on or turned off. Money moves markets. The source is increasingly Central Banks and Governments.
The recent response of policymakers to crises has been to throw in more liquidity and take on still more debt. In July, the US raised the Federal debt ceiling by another US$5 trillion. Think also of the latest RMB10 trillion surge in Chinese liquidity in 2025 and the increasing use of short-dated Treasury bills to fund America’s yawning Federal deficit. Evidence, as well, are the big jumps in debt (US$14 trillion and US$18 trillion) and particularly liquidity (US$5 trillion and US$35 trillion) following the 2008 GFC and the 2020 COVID emergency.
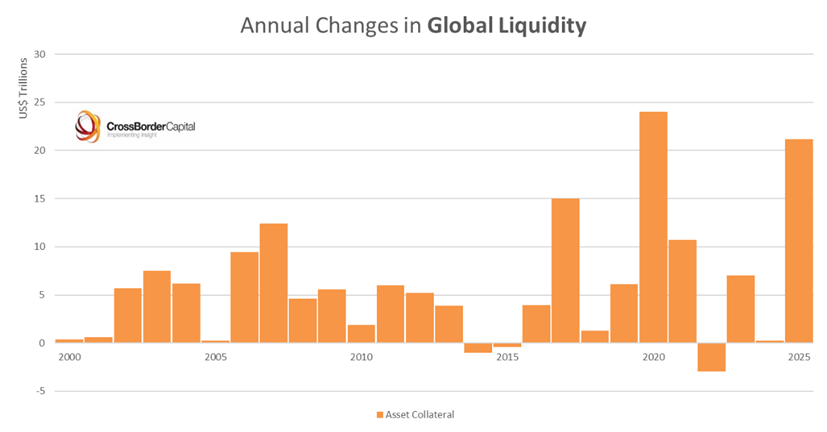
Consider the near-US$185 trillion pool of Global Liquidity, the aggregated amount of international cash savings and credits. This is two-thirds bigger than World GDP, and because it includes elements of shadow banking and repo market activities, it exceeds traditional money supply metrics by some US$70 trillion. Global Liquidity is US$12 trillion higher so far in 2025, boosted in part by America’s debt ceiling and the weaker US dollar, but still rising at a 14% annualised clip and so underpinning asset markets. Not surprisingly, Wall Street is again testing all-time highs, and Bitcoin is breaking ever higher.
In fact, Global Liquidity is up an impressive near-40% since 2019 and by more than a whopping 125% since the 2008 GFC. To add context, the IMF estimates that World GDP across the major economies is barely 50% higher in nominal terms and a lesser 30% up in real terms. So it’s little surprise that this excess liquidity has flooded into financial assets. Since their monthly lows in the 2008 GFC, World stock markets at mid-2025 are some 4.5 times higher, and Wall Street (S&P500) is an eye-watering near-sevenfold higher. Little surprise that speculators and momentum investors have bested the performance of traditional value funds in recent decades.
Looking ahead, we likely face more of the same. Monetary inflation hedges, like good quality equities (e.g., S&P500), gold, and, particularly, Bitcoin, will continue to outperform, underpinned by rising Global Liquidity. World financial markets are dominated by the need to refinance huge debts. On our calculations, as much as three-quarters of primary transactions now consist of debt roll-overs rather than new capital raising. These refinancings require liquidity in the form of balance sheet capacity within the financial sector. In addition, liquidity itself needs good-quality debts, like US Treasury bonds, to back it. According to the World Bank, close to 80% of all lending is now collateral-based. Understanding this debt-liquidity nexus is key.
The Debt-Liquidity Nexus
The debt-liquidity nexus measures movements over time in the ratio between debt and liquidity. The schematic diagram below explains this debt-liquidity cycle. The right-hand side shows that some three-quarters of all primary transactions in World financial markets involve some form of debt refinancing. Here, bond term premia and credit spreads alert investors to growing risk. However, the left-hand side often gives an earlier risk warning. Focusing on the repo and collateral markets, and specifically SOFR spreads and bond volatility metrics, like MOVE, can give a heads up to refinancing problems.
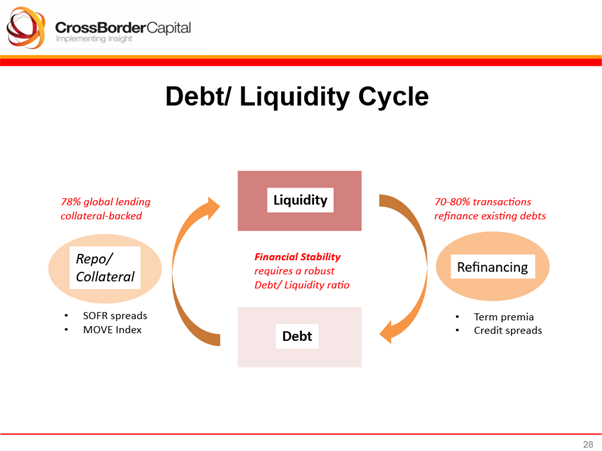
Collateral markets are central to modern finance, given their outsized role in supporting liquidity creation. Evidence US Treasuries, which are particularly important in backstopping peer-to-peer loans within the financial sector. It is not just the absolute size of the collateral pool that matters, because credit providers, typically dealer-banks, demand ‘haircuts’ on posted collateral as insurance against future value changes. The size of these ‘haircuts’ and, hence, the size of the collateral multiplier and ultimately Global Liquidity itself all depend on low bond volatility. A key measure of bond volatility across the US Treasury term structure is the MOVE index.
The following chart shows the recent gyrations in the debt-liquidity ratio. Across the Advanced economies, this ratio has averaged just over two times since 1980. What’s more, it is a mean-reverting series. Large deviations spell trouble. Refinancing crises tend to occur in periods when the debt burden dominates liquidity, and asset bubbles, like now, are associated with periods when the pool of liquidity surpasses the stock of debt.
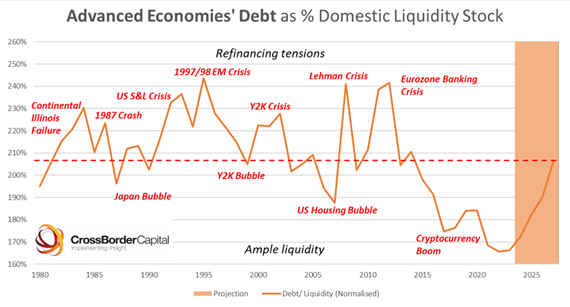
By slashing interest rates to zero during COVID—a level previously unheard of in over four millennia of World history, according to Sidney Homer’s seminal A History of Interest Rates—borrowers were incentivised to both borrow more and to term-out their existing debts into future years, so lowering the effective debt/ liquidity ratio. These debts now make up the so-called debt maturity wall that is slated to be repaid through 2026-29. The more than US$10 trillion needed for refinancing will absorb precious liquidity.
This party in risk assets may not end soon, but we all know that it never ends well. Politicians typically kick the can down the road until they stub their toe on a debt funding crisis. To ensure financial stability, more debts demand more liquidity from policymakers. The key role played by Global Liquidity in refinancing debt means that investment ‘genius’ may simply come down to judging how fast our future debts will grow. We are in a World of fiscal dominance, where Central Banks are forced into ever greater monetary inflation. In this World, investing in dedicated monetary inflation hedges makes a lot of dollars and sense.
A Closer Look at the US Treasury Market
Building off of CrossBorder Capital’s Debt/Liquidity Cycle diagram above, we understand that focusing on volatility metrics can provide a heads up to refinancing risks. To start off, let’s look at implied bond volatility against realized bond volatility:
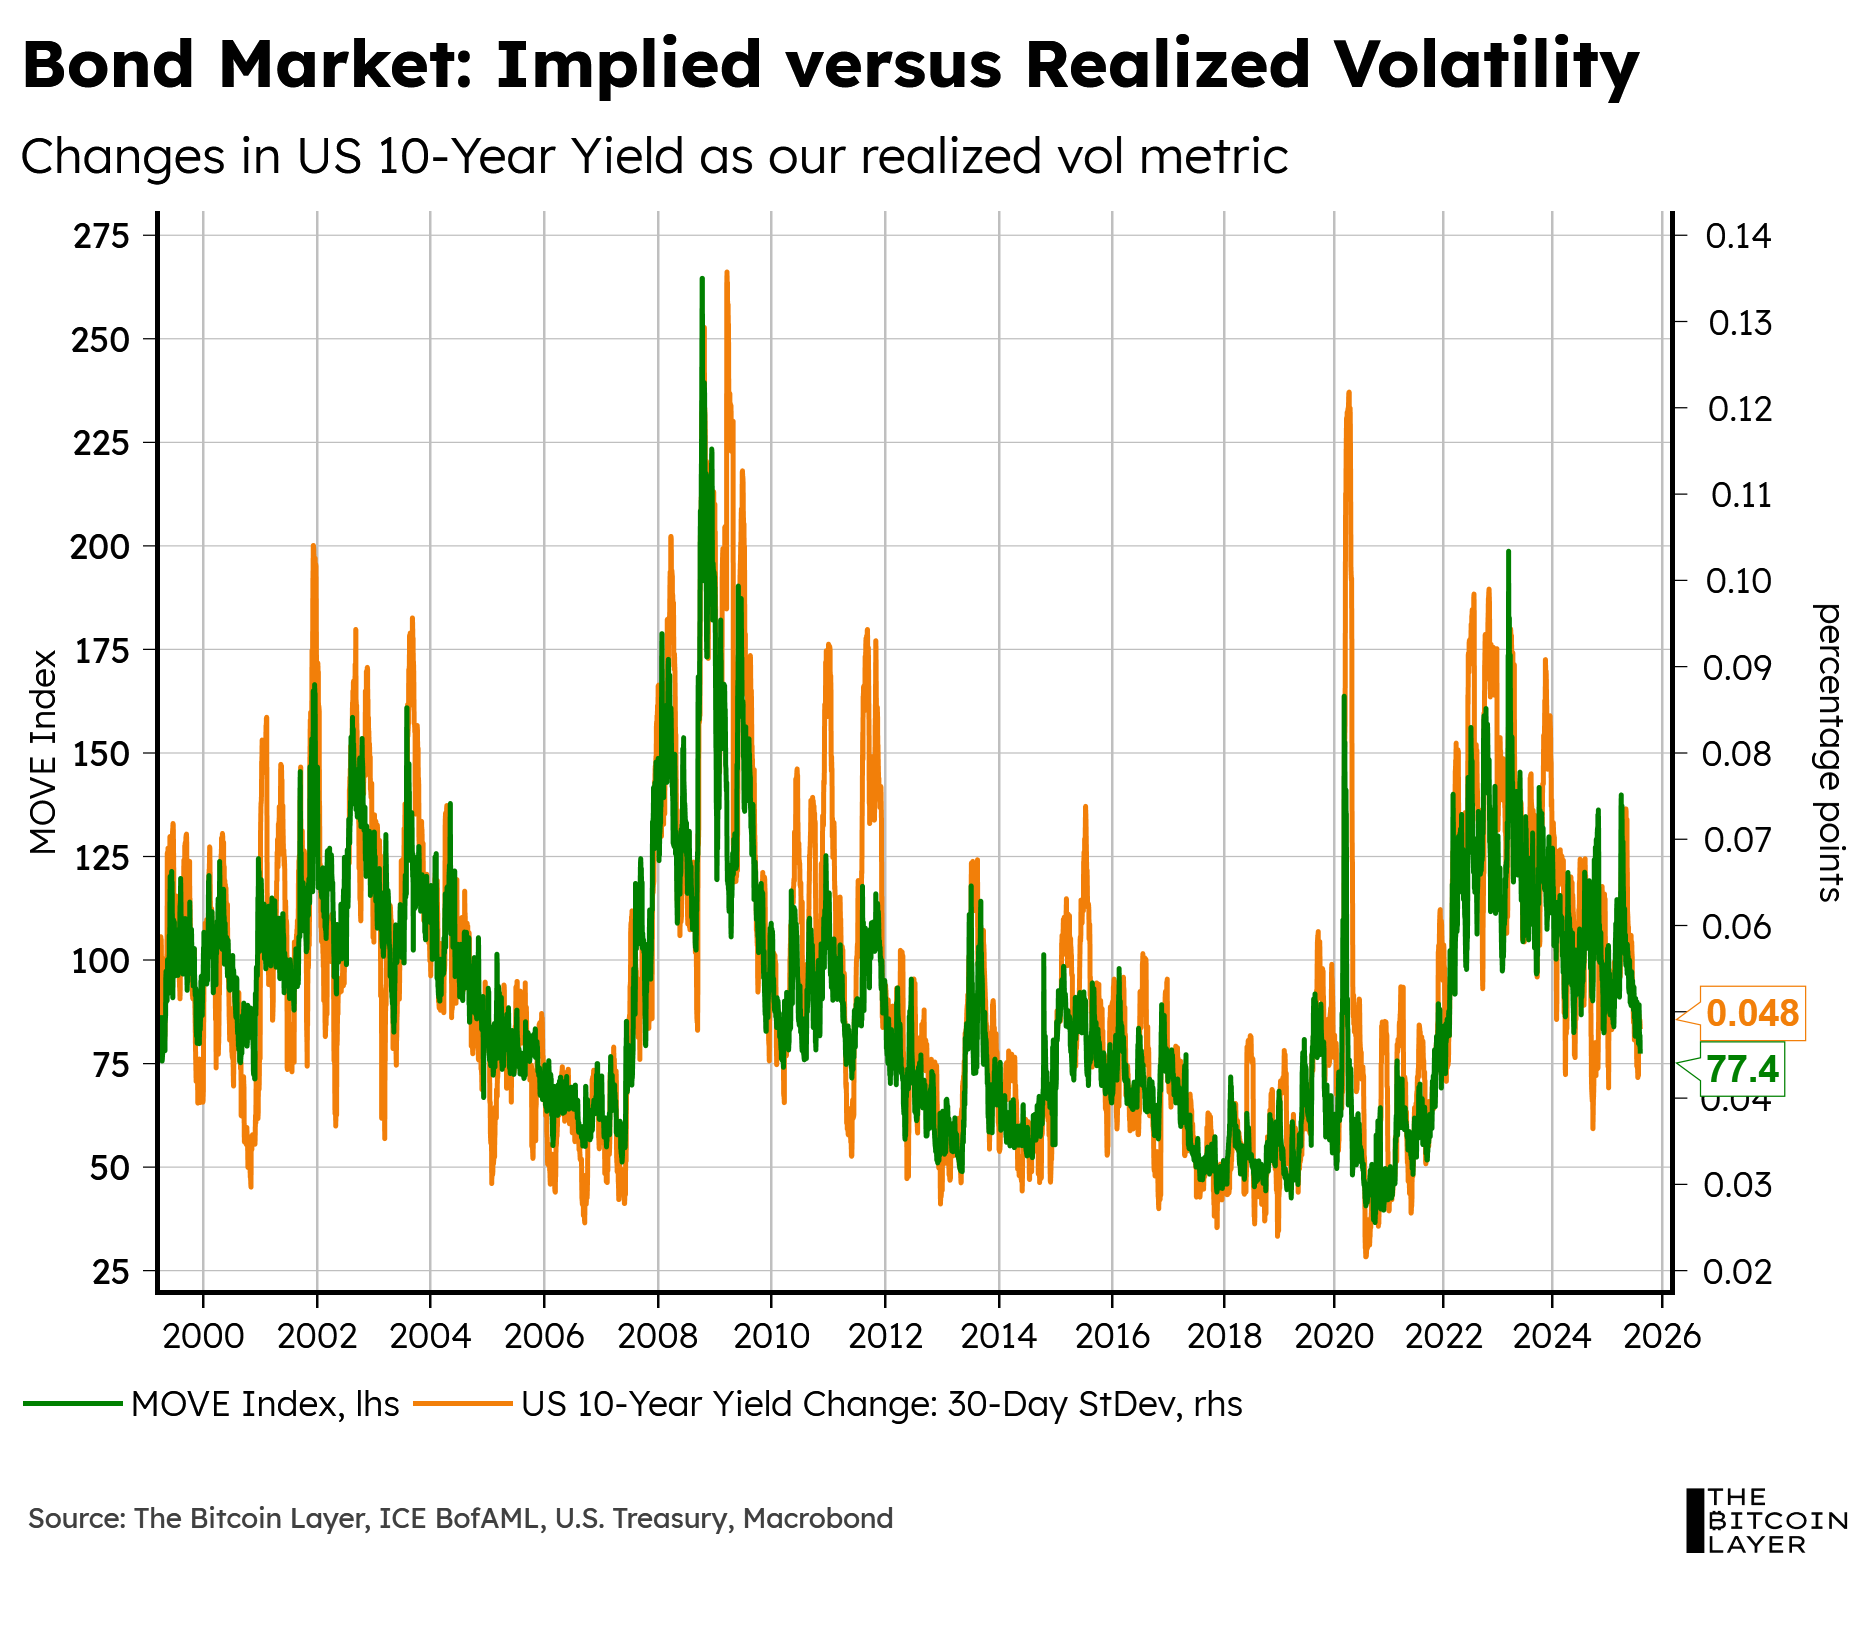
The chart is merely here to portray just how closely the MOVE Index follows realized volatility, which serves as reinforcement for our usage of it to gauge bond market volatility.
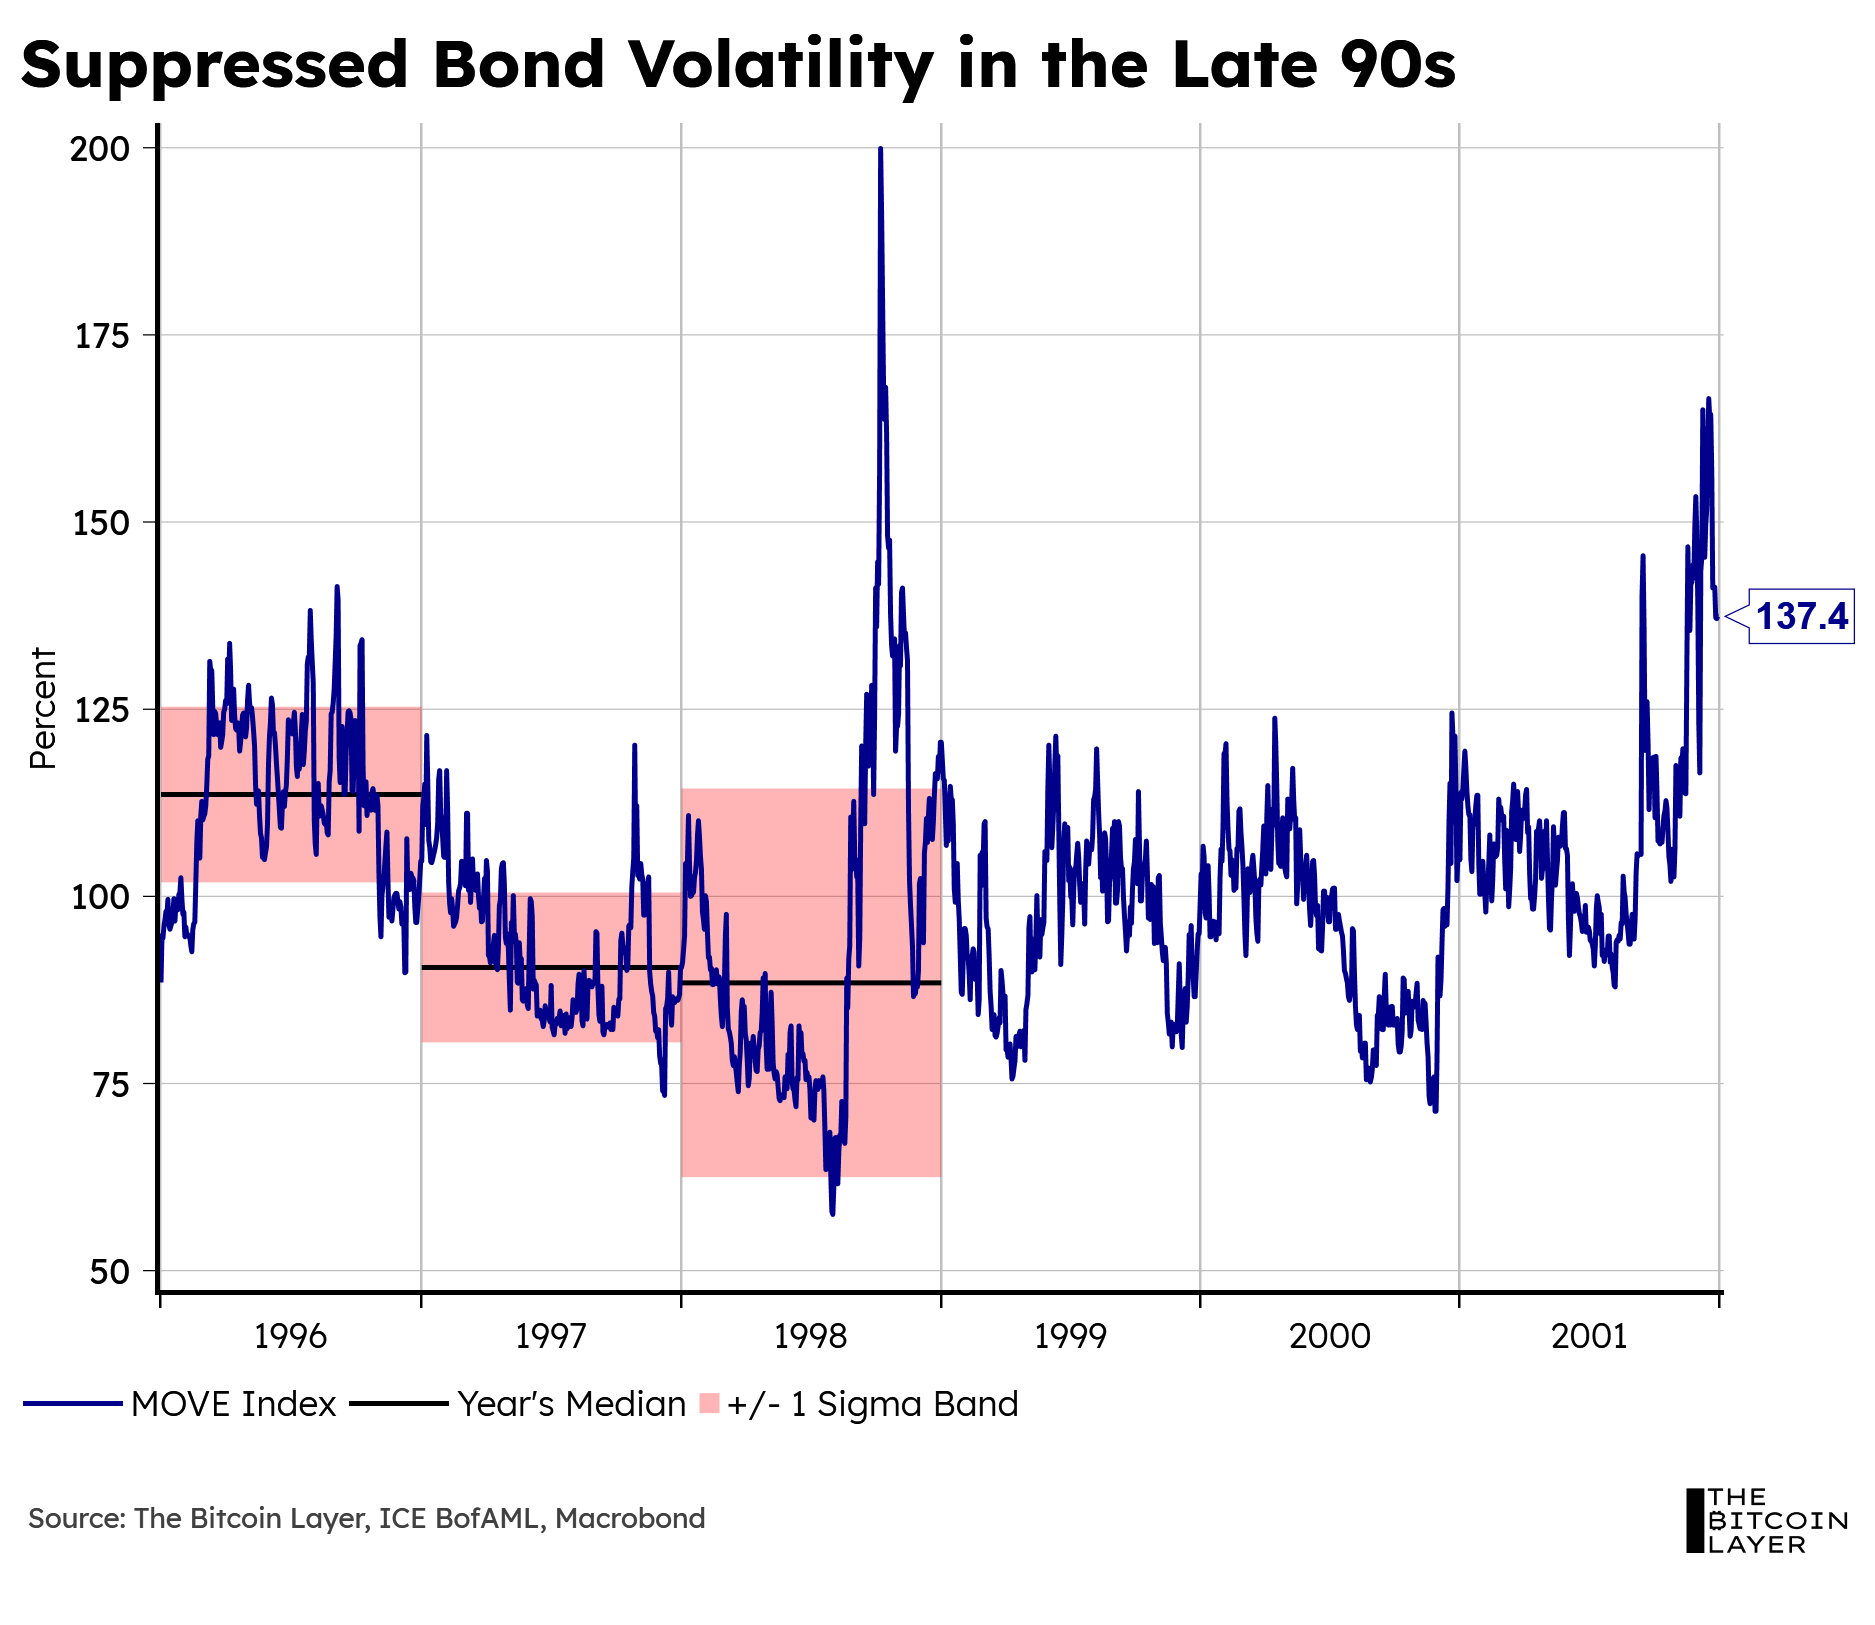
Since the year 2000, periods of high debt/liquidity ratios have followed periods of relatively suppressed bond volatility. Starting with the dot-com crisis, from 1996-1998, bond volatility trended downwards before breaking to the upside during a refinancing tensions period:
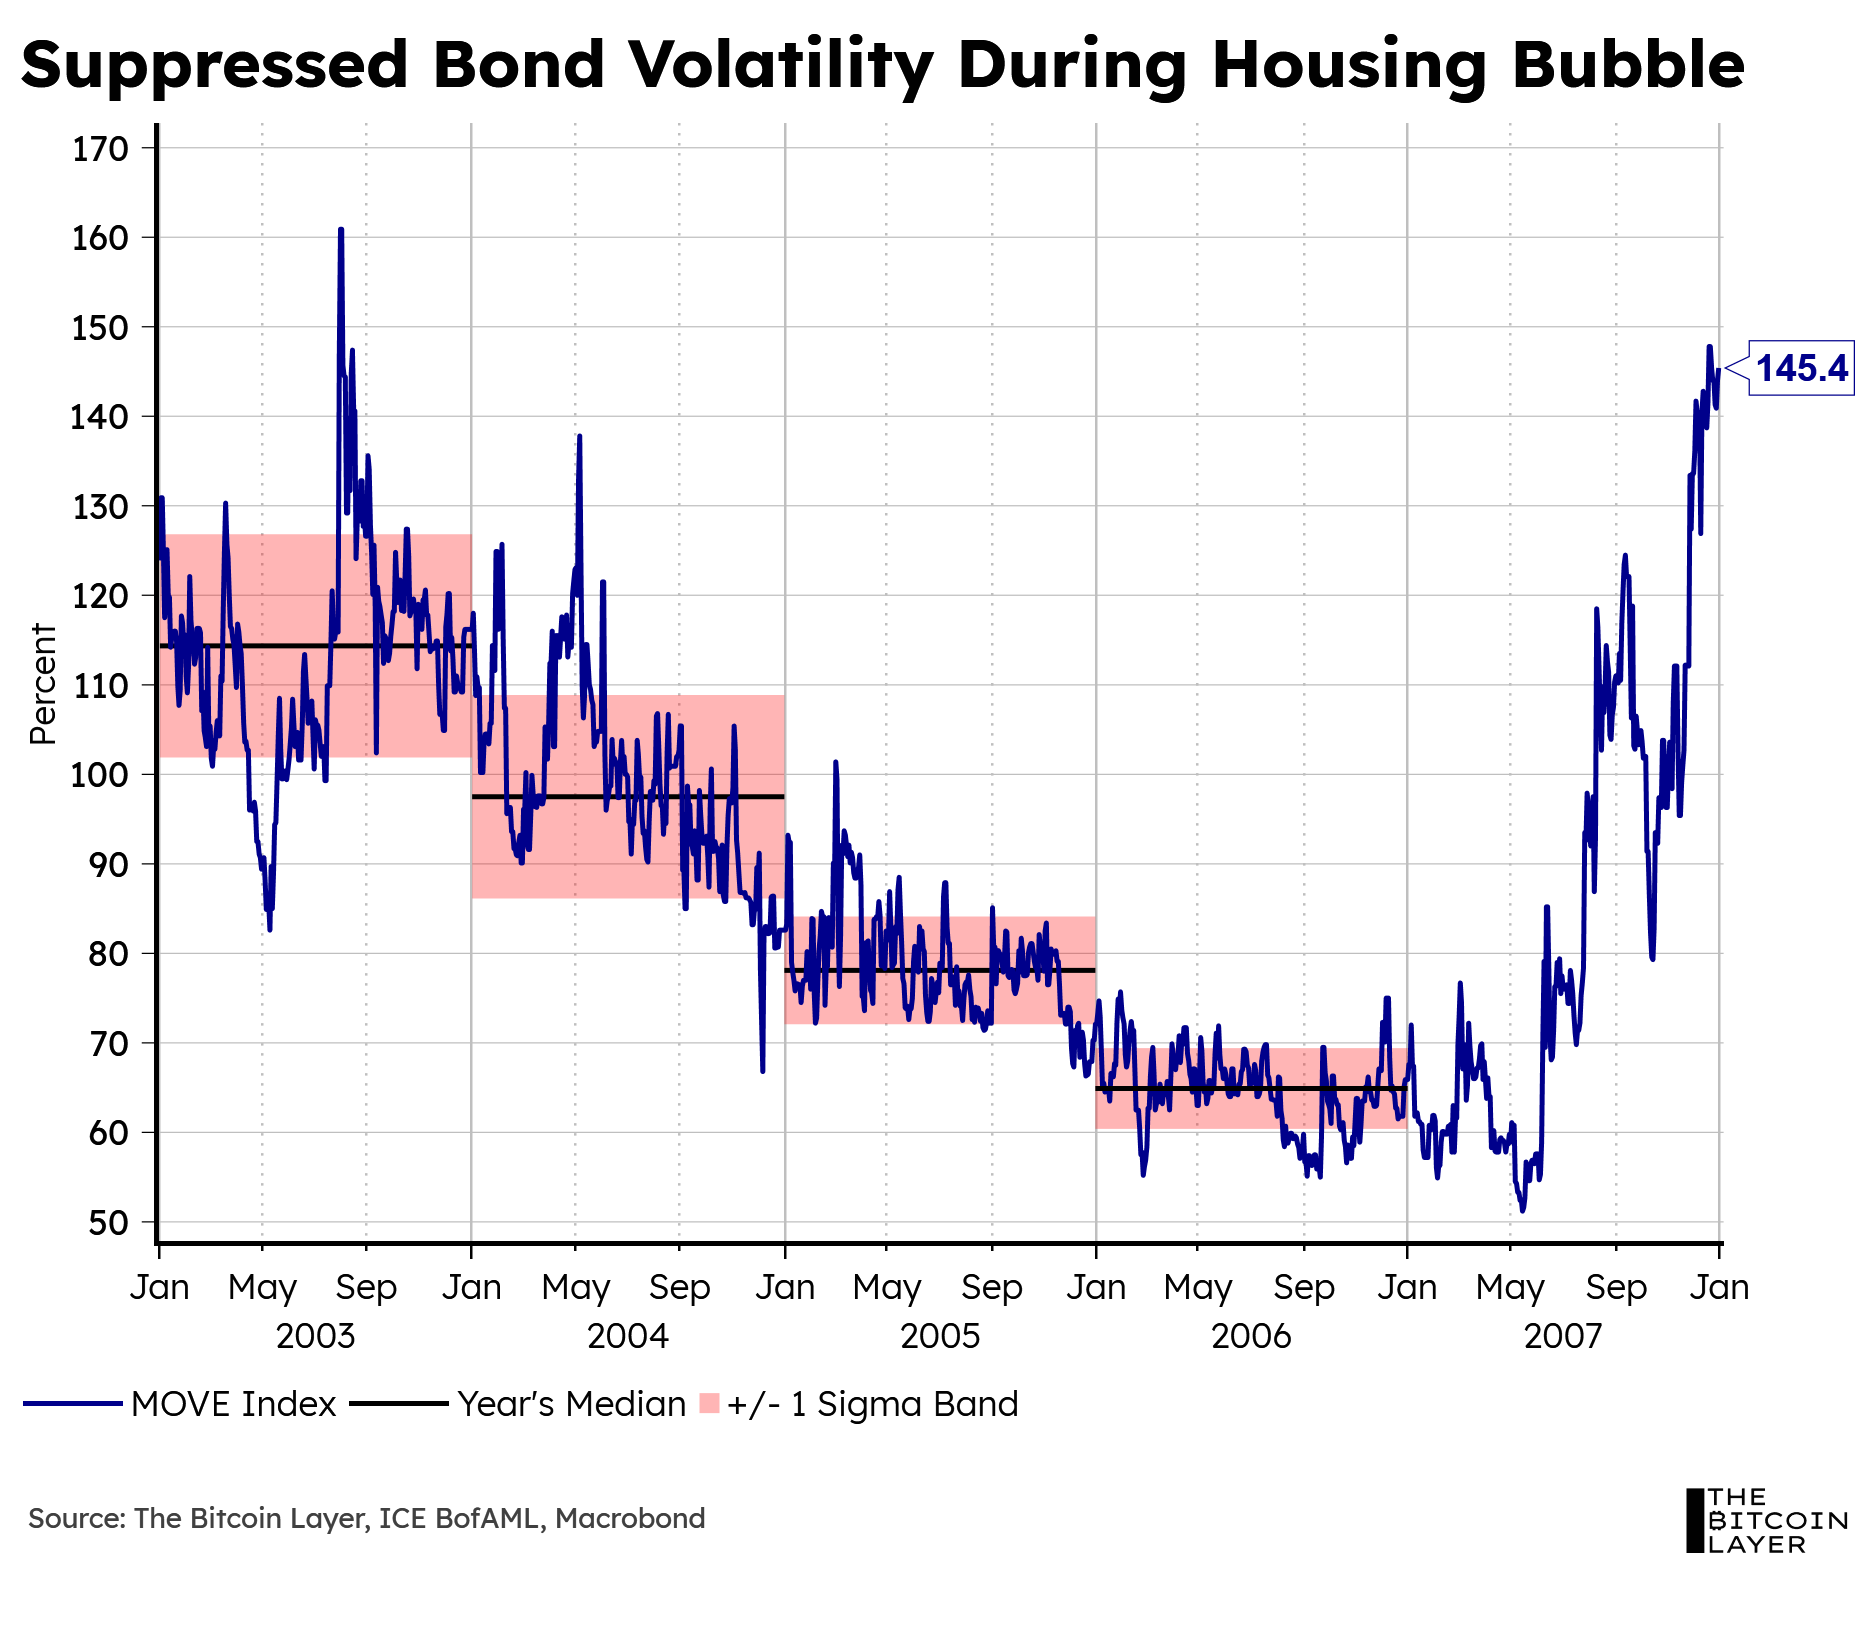
Moving on to 2003-2006, before the GFC, we see yet another period of suppressed bond volatility:
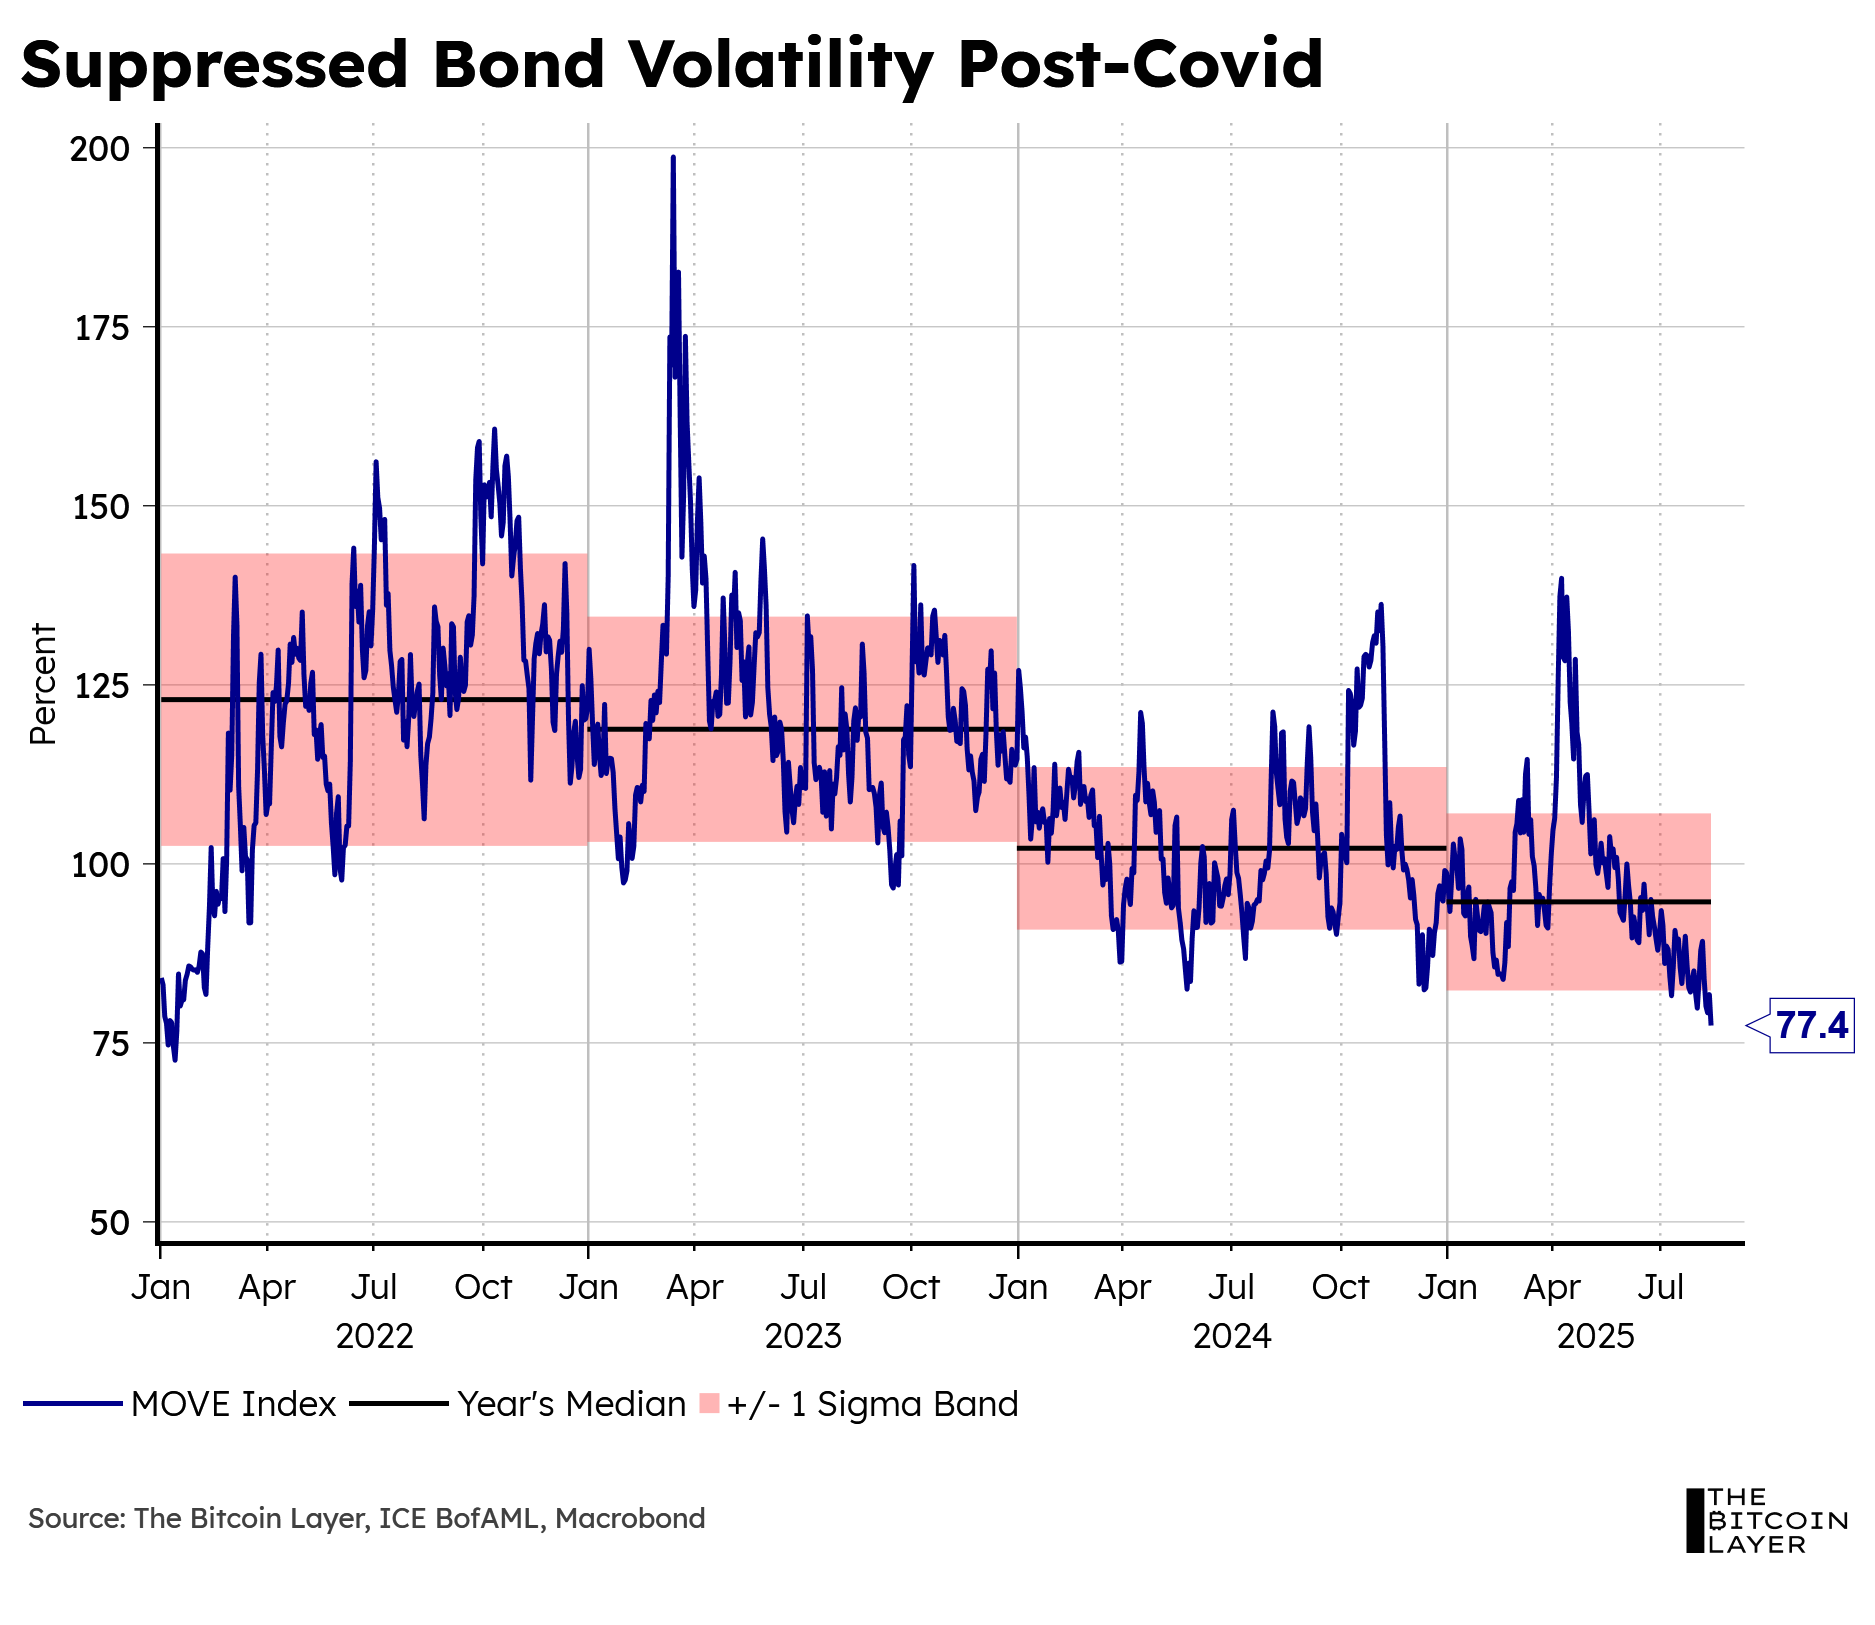
What about during today’s Roaring 2020s? Specifically, post-COVID crisis, from 2022-2025. That’s right! More suppressed bond volatility:
This look at history confirms what the CrossBorder Capital team puts forward in their Debt/Liquidity Cycle diagram: that bond volatility metrics have given markets earlier risk warnings. Recent asset bubbles have existed during periods of low bond volatility because when good-quality assets (like US Treasuries) are stable, that means lower haircuts in repo markets, which allows for even more global lending.
As per repo market warning signs, we are seeing a growing number of instances in which the SOFR rate surpasses the EFFR rate. In other words, overnight borrowing backed by safe collateral is more expensive than borrowing solely on creditworthiness—a sign that repo markets are becoming increasingly tighter.
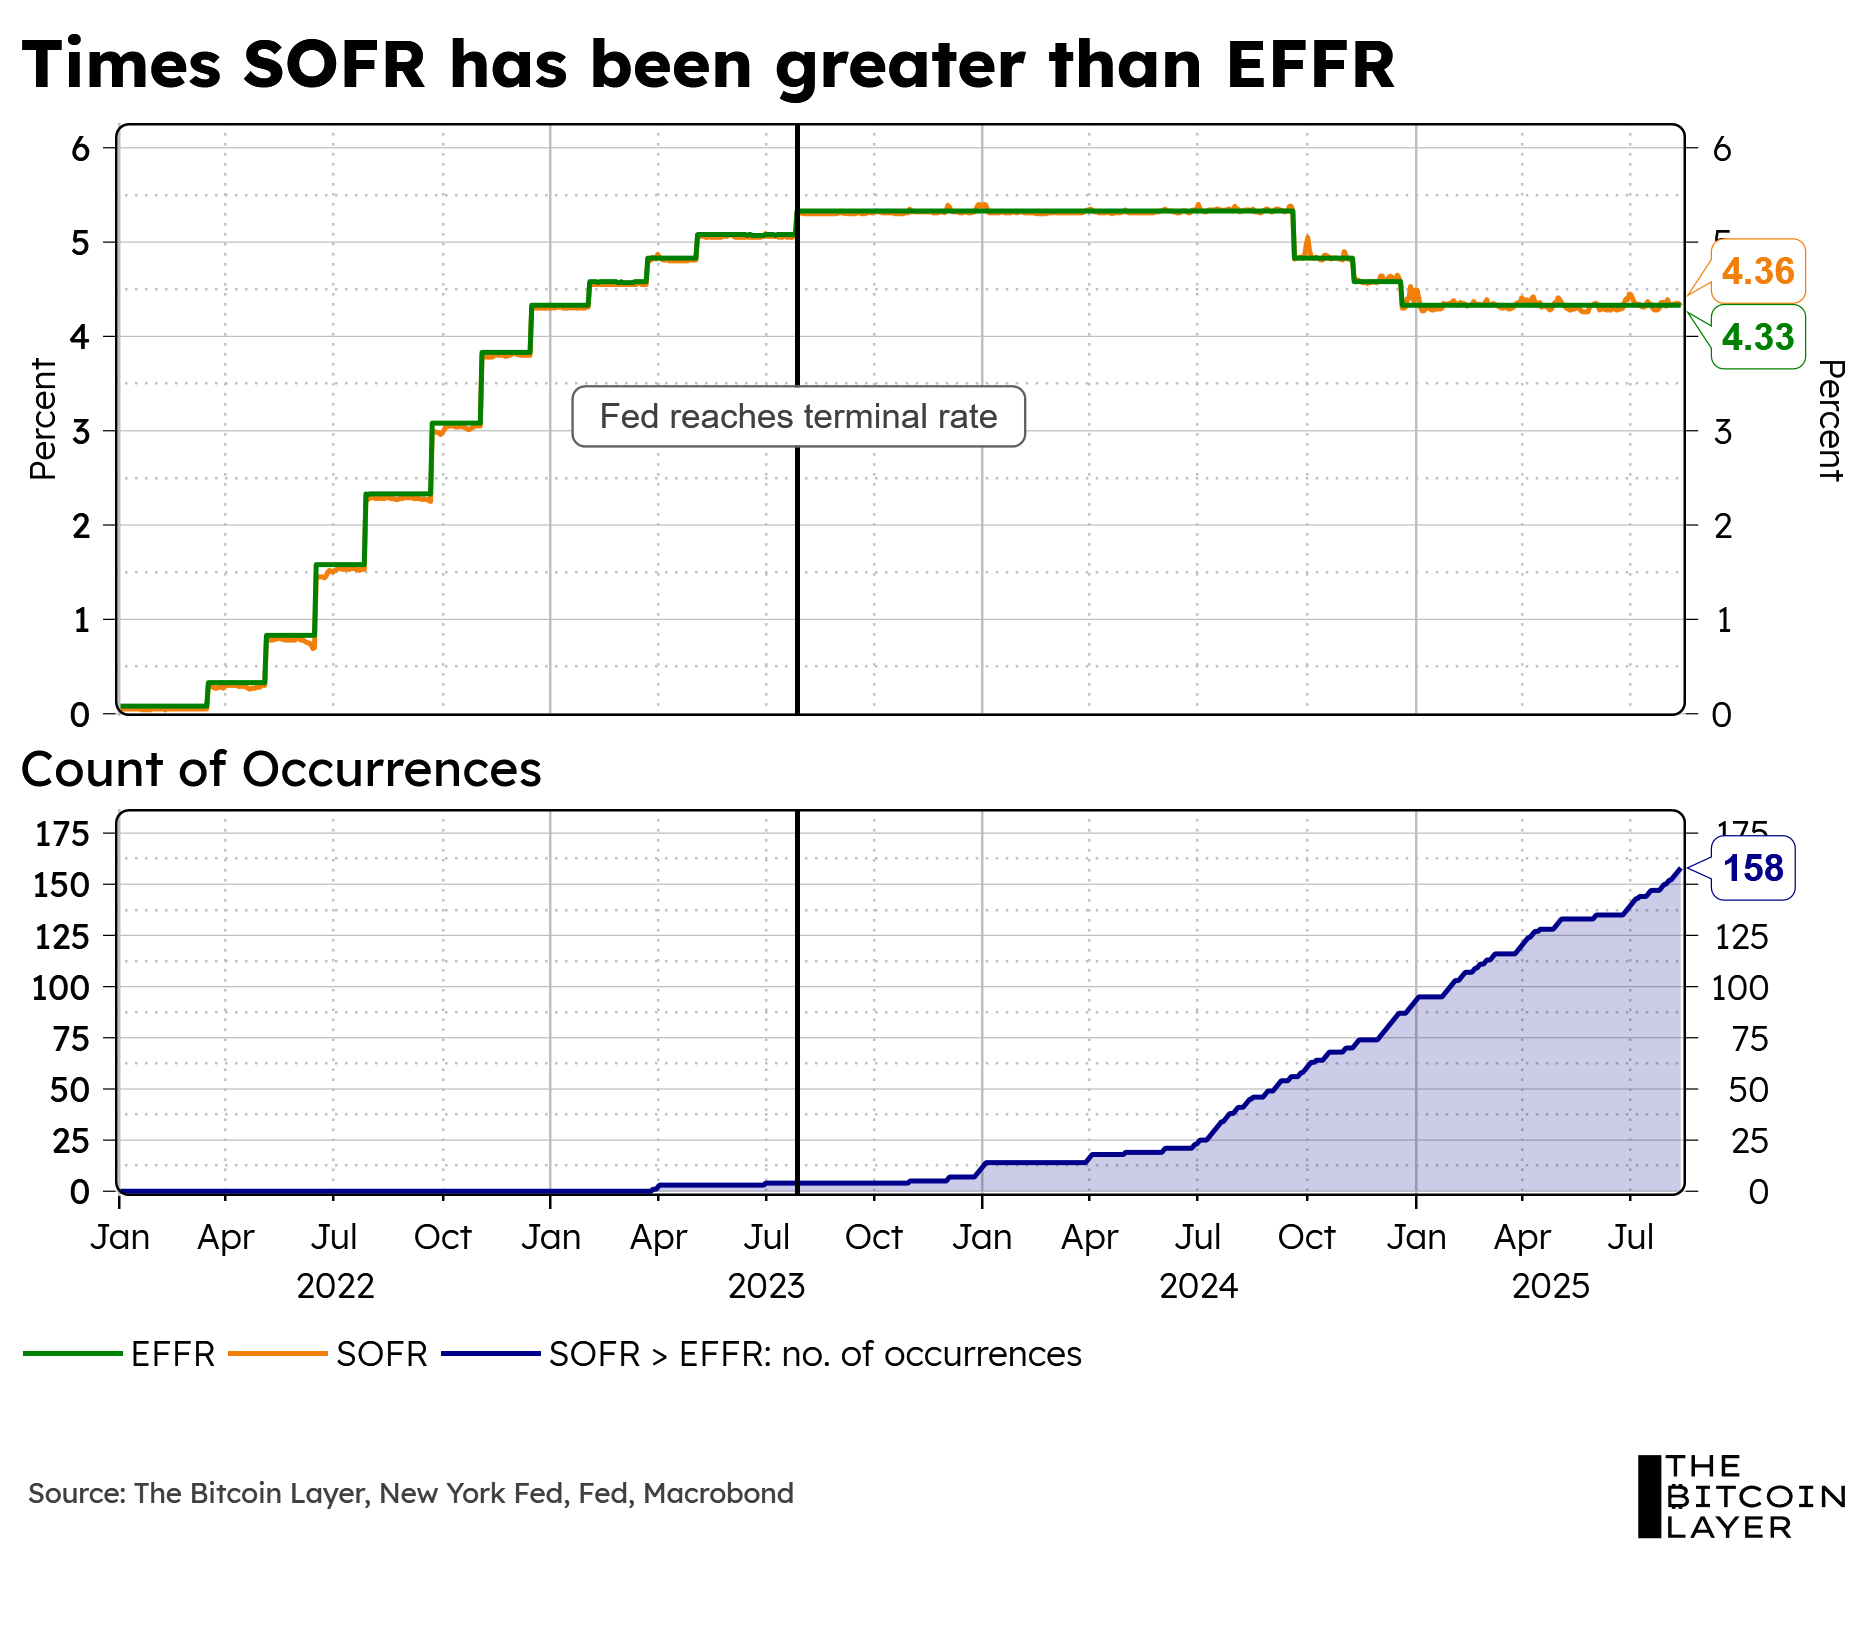
Notice how most occurrences of the SOFR rate being greater than the EFFR rate have taken place after the Fed reached the terminal rate, back in mid-2023.
An important caveat is that SOFR market volumes have nearly doubled since the start of 2024. The lower volumes pre-2024 partly explain the fewer instances in which SOFR surpassed EFFR—$1.5T is obviously significant, but it represented a smaller, less liquid market at the time.
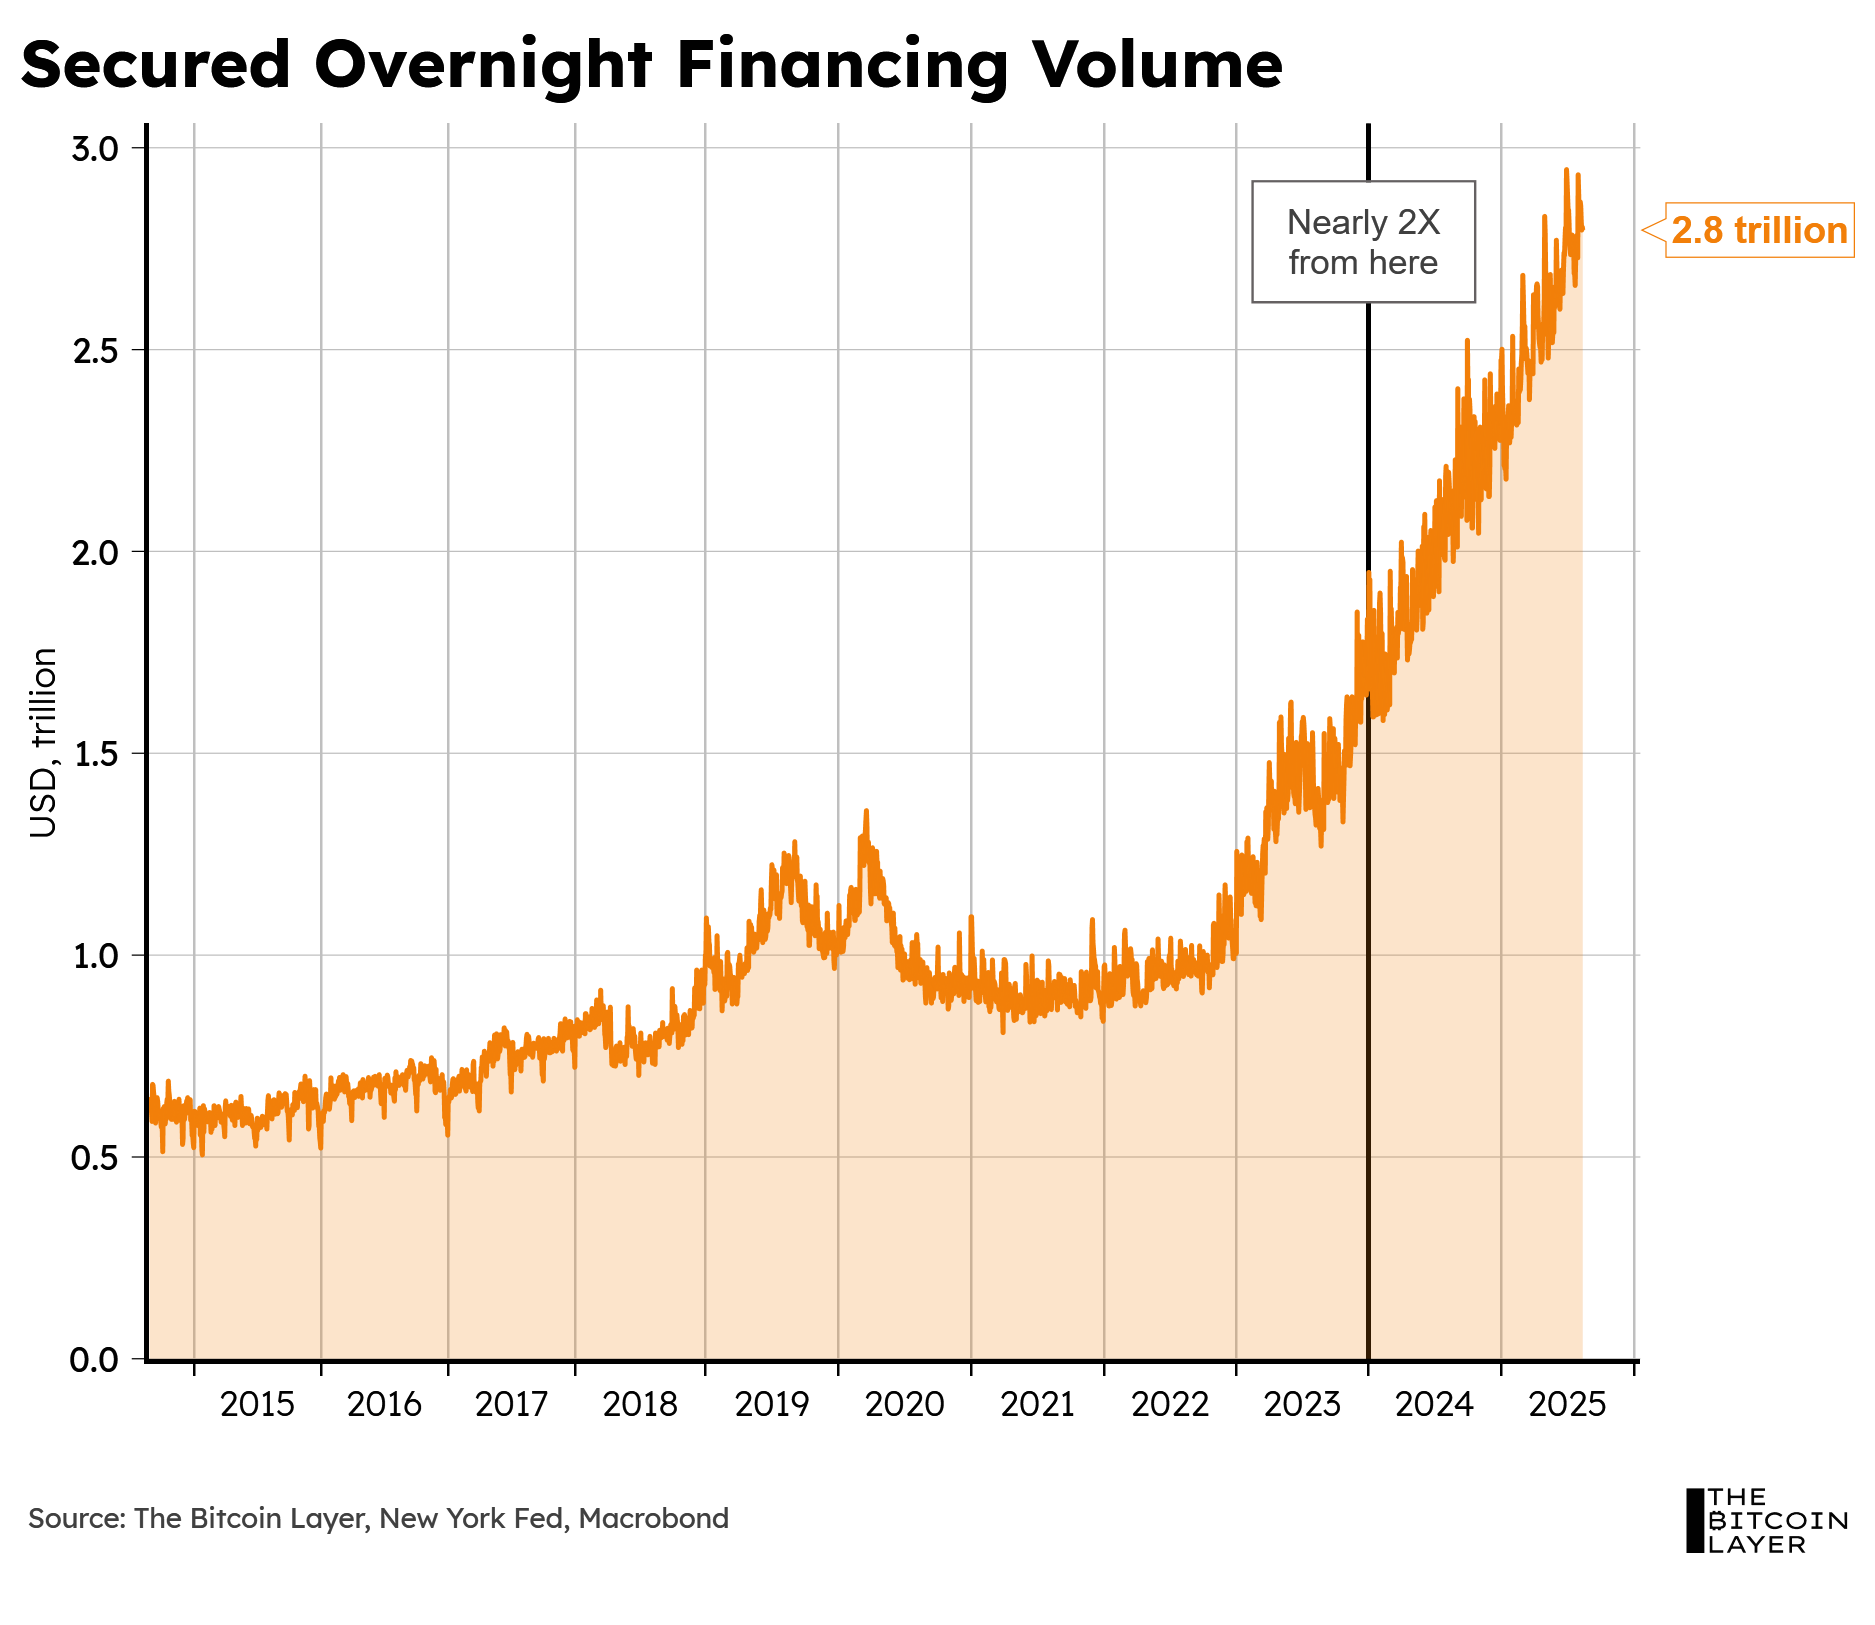
Nevertheless, the sustained incline in the number of times SOFR has surpassed EFFR post-2024 still signals tighter repo market conditions.
Do these warning signs mean that the party’s about to end?
Not if policymakers have anything to say about it. Looking at Fed policy, we have seen their attempts to ease repo market pressures by reducing the pace of QT. This creates more reinvestment by the Fed into assets like Treasuries, which consequently eases market pressures. All else equal, this supports risk assets due to stability in both collateral and overnight lending, leading to credit expansion.
We are also seeing an increasing number of FOMC members hinting at the fact that both sides of the Fed’s dual mandate are becoming more of a priority. Jerome Powell has expressed his disdain for tariffs in relation to the inflation part of the mandate. The Chairman has stated that the uncertainty behind tariffs and their effect on inflation has forced him to keep rates high and on ‘wait and see’ mode.
What are market expectations for Fed policy over the coming years?
The US 10-year yield minus the 1-year yield curve, generally speaking, showcases expectations of the 1-year yield over the next 9 years. If the curve is flat, that shows a market that is neither here nor there. The Fed has not made any credible enough commitments to cutting (or hiking) to push the market in either direction, which is why the curve’s spread is still near zero (or flat). Perhaps the market expects short-term rates to remain near 3.5% - 4%, on average, over the next 10 years:
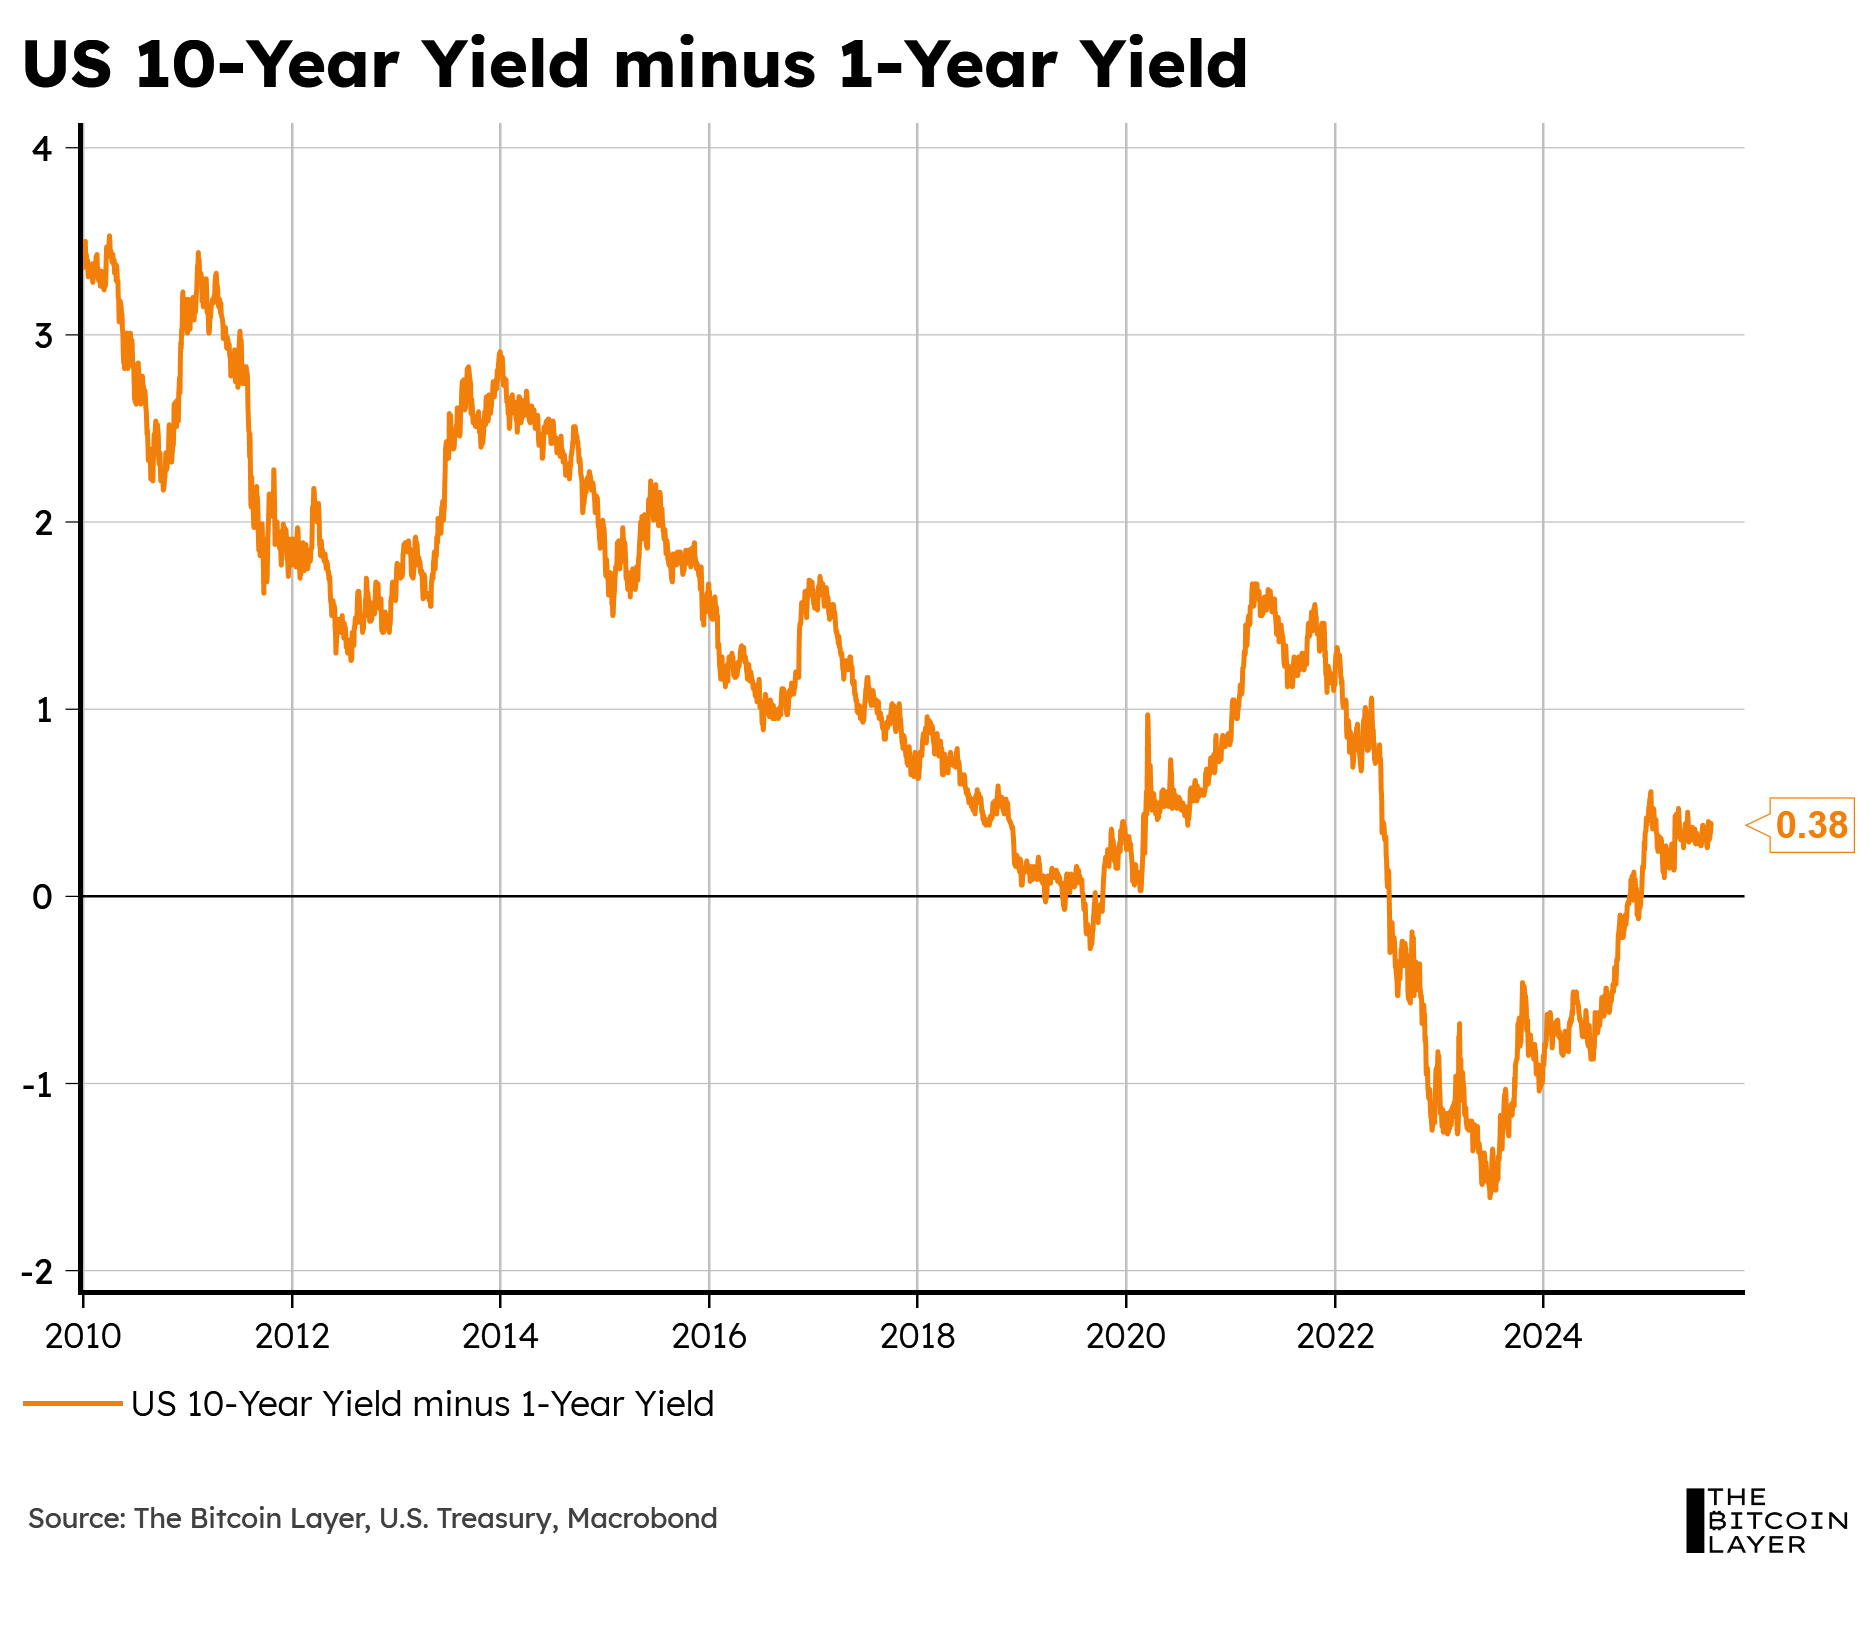
This is consistent with this article’s narrative that the party in risk assets is not over, but could experience some liquidity-absorption headwinds as we approach the latter half of the Roaring 2020s.
Other policymakers to watch for are those in charge of US Treasury issuance. As mentioned earlier, having money-like characteristics, T-Bills have increasingly become the go-to asset through which to plug any shortfalls in government borrowing:
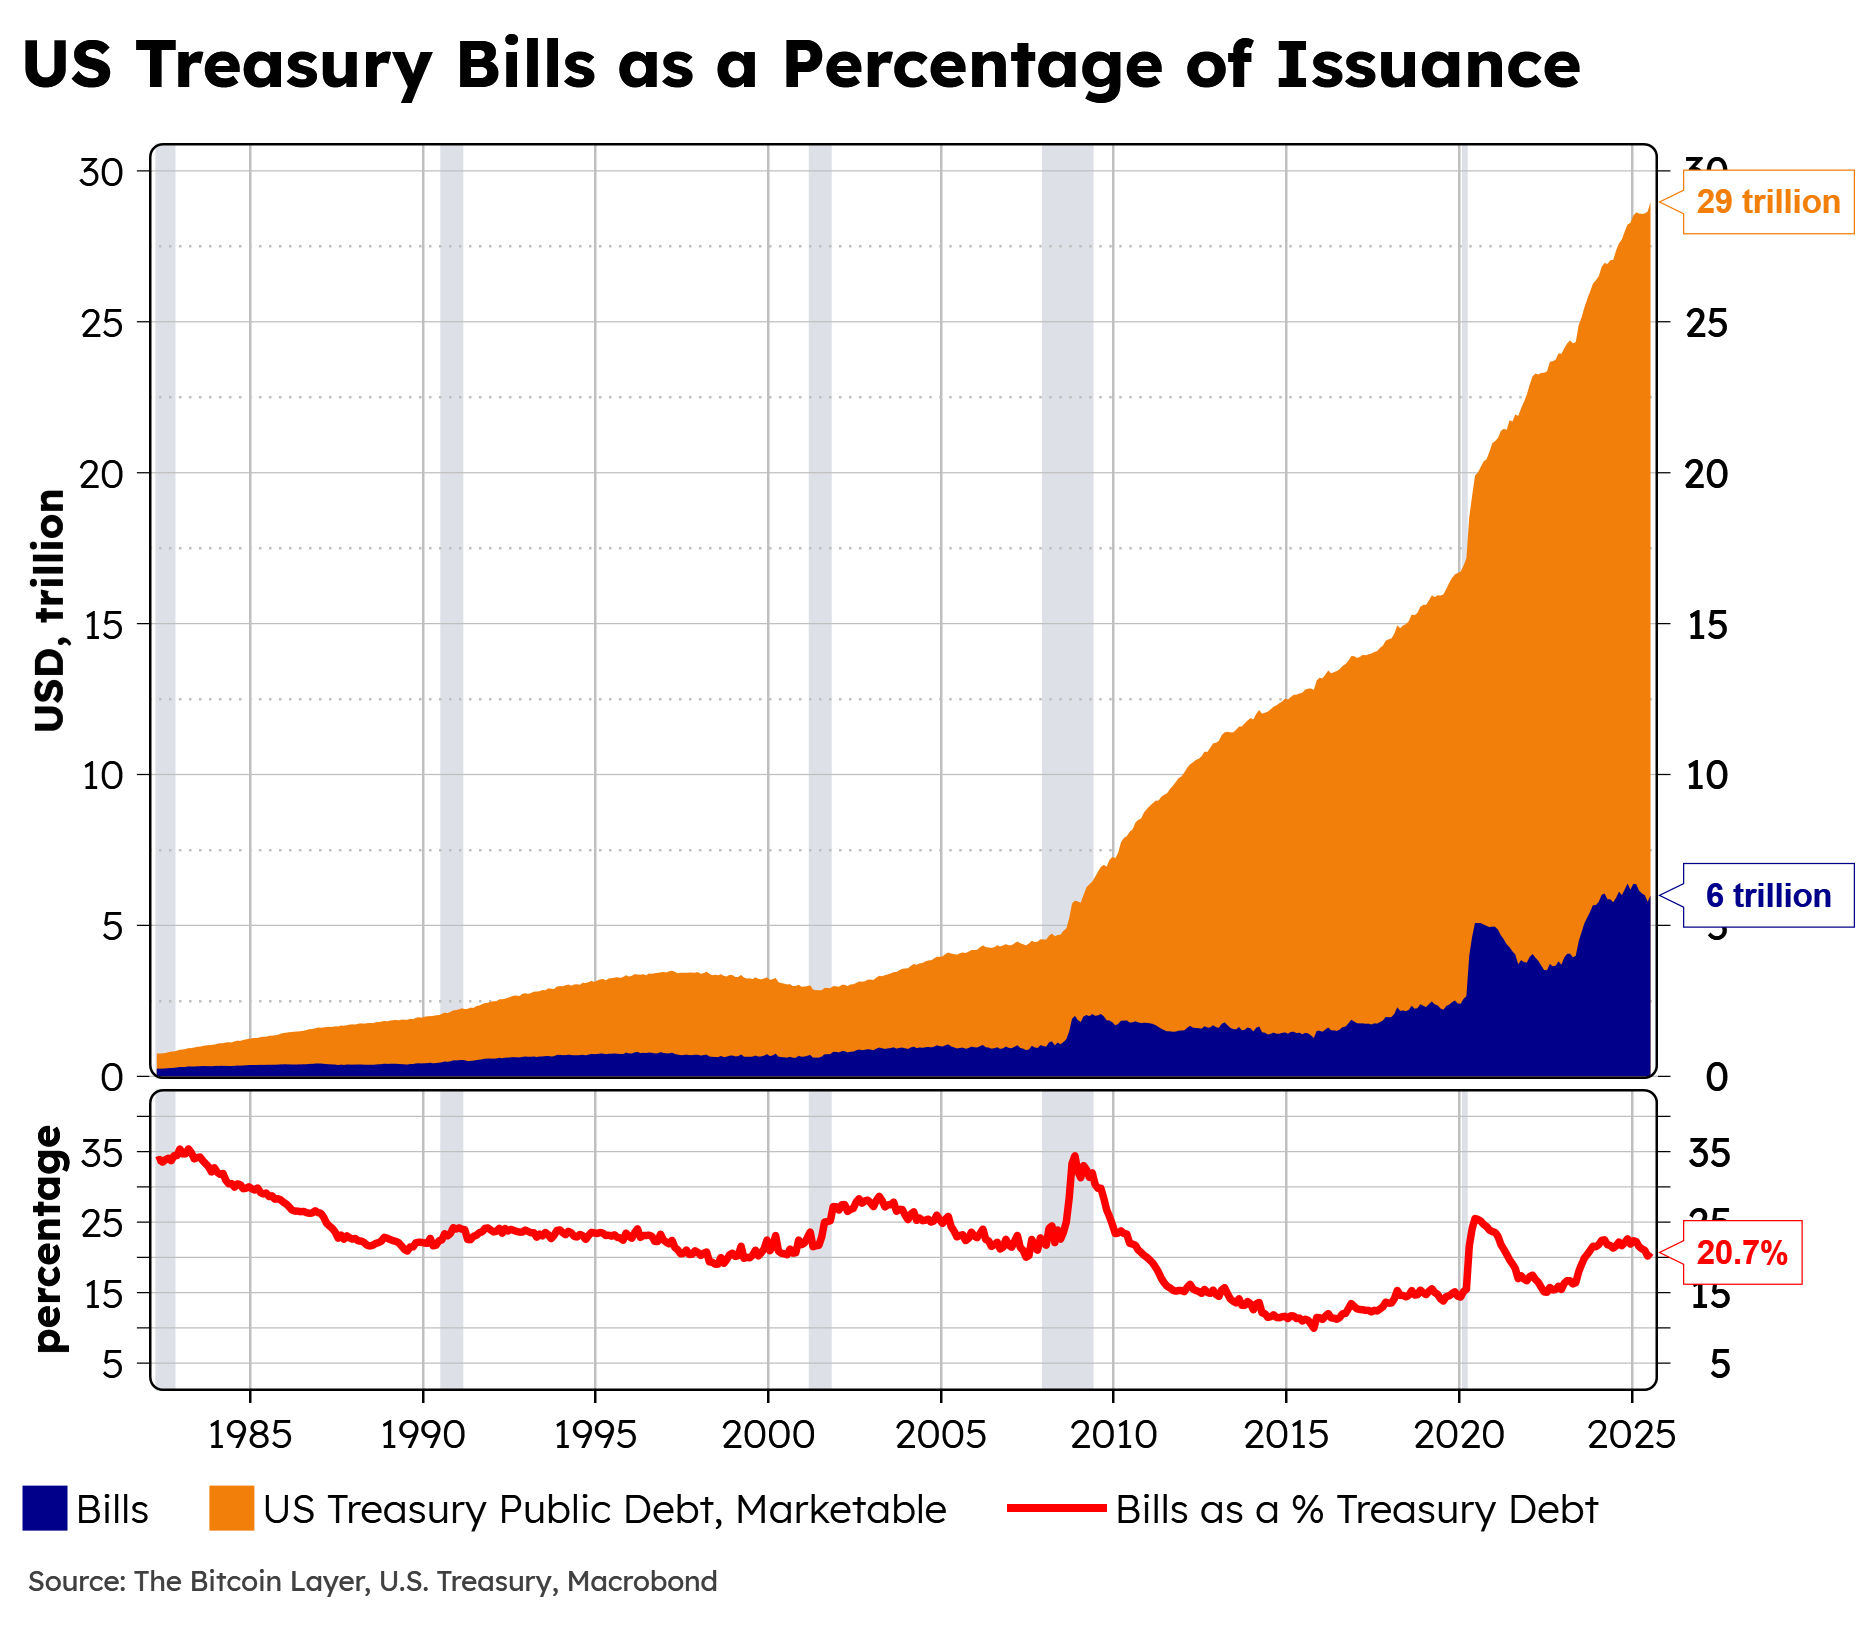
Although this poses incredible refinancing risks for the US government, it also helps maintain risk assets thriving, as duration risk stays off investors’ portfolios.
“Kicking the can down the road.”
Conclusion
We remain bullish on monetary-inflation-fighting assets like gold, bitcoin, and the S&P 500 as we close out the Roaring 2020s.
Refinancing tensions may be felt during the latter half of the 2020s as all the term-out loans from the low-interest rate era come due, but as the CrossBorder Capital team puts it, “In this world, investing in dedicated monetary inflation hedges makes a lot of dollars and sense.”
Got questions? Join our Live Zoom Q&A this Thursday with both Nik and Michael Howell and ask them your questions directly!
Thursday, August 21st, 2025 @ 9:00 AM PT (12:00 PM ET) - registration link to follow for paid subscribers

A collaborative post by:
Dr Michael J. Howell has worked in finance for over 30 years. Formerly Research Director at Salomon Bros where he developed the concept of 'Global Liquidity'. He is author of 'Investing in Emerging Markets' (1995) and 'Capital Wars' (2020).
Nik Bhatia
Nik Bhatia is a financial researcher and Adjunct Professor of Finance at USC Marshall School of Business, where he teaches courses on fixed income and digital assets. He is the author of the bestselling books Layered Money and Bitcoin Age, and previously worked on the U.S. Treasuries trading desk for a major institutional asset manager.
Augustine Carrasco
Augustine Carrasco is a Canadian financial researcher at The Bitcoin Layer with a Finance degree from UBC’s Sauder School of Business and experience in private markets and financial accounting.
 | A guest post by
|
 | A guest post by
|
Hello, awesome article! Will the Q&A be posted here on Substack?