


‘Liquidity Investing’ Or Why The ‘Fed Model’ Is Wrong

Standard asset allocation models, such as the ‘Fed model’, are derived from individual security analysis and pay scant attention to aggregate investor behaviour and the credit cycle. Instead, too much weight is placed on near-term reported profits, while changes in the discount factor are largely ignored. In this article, we show that the bulk of variation in stock prices, up to approximately a 5-year horizon, is dominated by changes to the discount factor. The discount factor is moved around by inflation and liquidity. We propose an alternative framework that captures these changes.
Main Points
· Standard asset valuation models do not work well at the macro-level
· Specifically, they fail to understand changes in the discount factor, or P/E
· P/E changes are dominated by underlying inflation and by liquidity
· We propose an alternative model based on investor behaviour, which incorporates flow of funds analysis
The so-called ‘Fed model’ is another name given to what the finance textbooks refer to as the Gordon growth’ or ‘earnings discount model’: P = E/ (k-g), where the market P/E ratio, or discount factor, is inversely related to the difference between a discount rate (k) and the implied future growth of earnings (g). The discount rate is often assumed to consist of a 10-year risk-free government bond yield plus a notional equity risk premia.
The ‘Fed model’ is a popular tool for valuing aggregate stock markets. However, it is theoretically questionable and works poorly in practice at the macro-level. Using it would have missed the Japanese stock market’s strong gains through the 1970s and 1980s, and wrongly kept investors in the European rather than the US stock market over the past two decades. Some miss!
We propose an alternative framework better-suited to top-down investing that is based on investor behaviour and incorporates flow of funds analysis. We show that the visible instability of the discount factor in the standard model, in fact, shows the response of asset prices to changes in the flow of liquidity and re-allocations of assets, notably when underlying inflation changes.
Problems With The Standard Asset Allocation Model
Aggregate stock prices are determined, by definition, from earnings (E) scaled up by a discount factor (P/E). For example, let earnings per share grow by 25%, and assume that the prevailing dividend yield is negligible and that the P/E does not change over time. The annual return will therefore also turn out to be 25%. Much macro forecasting is done in this way and often with the added twist that aggregate P/Es are compared between national markets at specific points in time. This allows analysts to make heroic statements, such as ‘European markets are ‘cheap’’. As we shall argue, what they can at most infer at the macro-level is that these markets are potentially ‘under owned’ from an asset allocation perspective.
In practice, fluctuations in aggregate stock prices up to around a 5-year time horizon largely result from changes in the P/E rather than from changes in the E. In short, the P/E multiple does not stand still. These are what we call macro-valuation shifts. They are critical. We accept that over longer time-horizons, the tendency of the P/E ratio to mean-revert means that equities are more closely related to trend earnings growth. [Note: ‘earnings dominance’ occurs from year 6 for US stock indexes, 1975-2022.]
Figure 1: Annual Changes in S&P 500 Index and Changes in Reported Earnings, 1975-2023
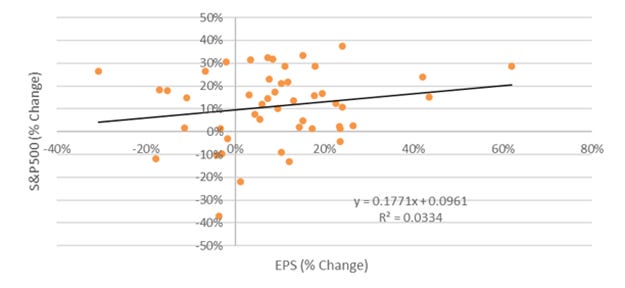
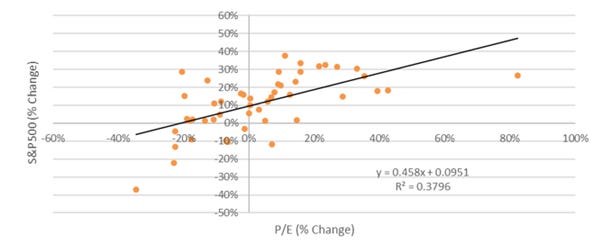
Evidence Figures 1 and 2. These, respectively, report the scatter diagrams between movements in US reported earnings and the S&P500, and movements in the P/E and the S&P500. Although there is a positive relationship between stock returns and earnings growth, the bulk of stock market variation over this investment horizon is plainly about a changing discount factor, not changing earnings.
Figure 2: Annual Changes in S&P 500 Index and Changes in P/E Multiple, 1975-2023
Inside The PE Multiple
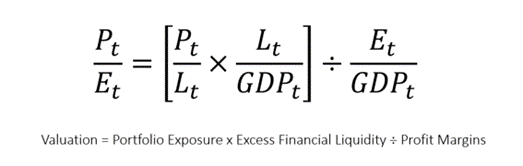
This, therefore, leads on to a second question as to what determines changes in the discount factor, i.e., the P/E? The formula below deconstructs the P/E into three components: (1) an asset allocation factor (P/L); (2) a liquidity factor (L/GDP) and (3) a profitability factor (E/GDP). What this decomposition of market valuation can show is that macro-valuation shifts predominately come from changes in the first two terms. It seems to make more sense to understand changes in these components, rather than to focus on the P/E itself. The implication, as shown by the data, is that market P/Es are highly unstable and at, first sight, appear unpredictable:
Keep reading with a 7-day free trial
Subscribe to Capital Wars to keep reading this post and get 7 days of free access to the full post archives.