

Global Liquidity Watch: Weekly Update
Global Liquidity Watch: Weekly Update
Global Liquidity conditions edged higher last week

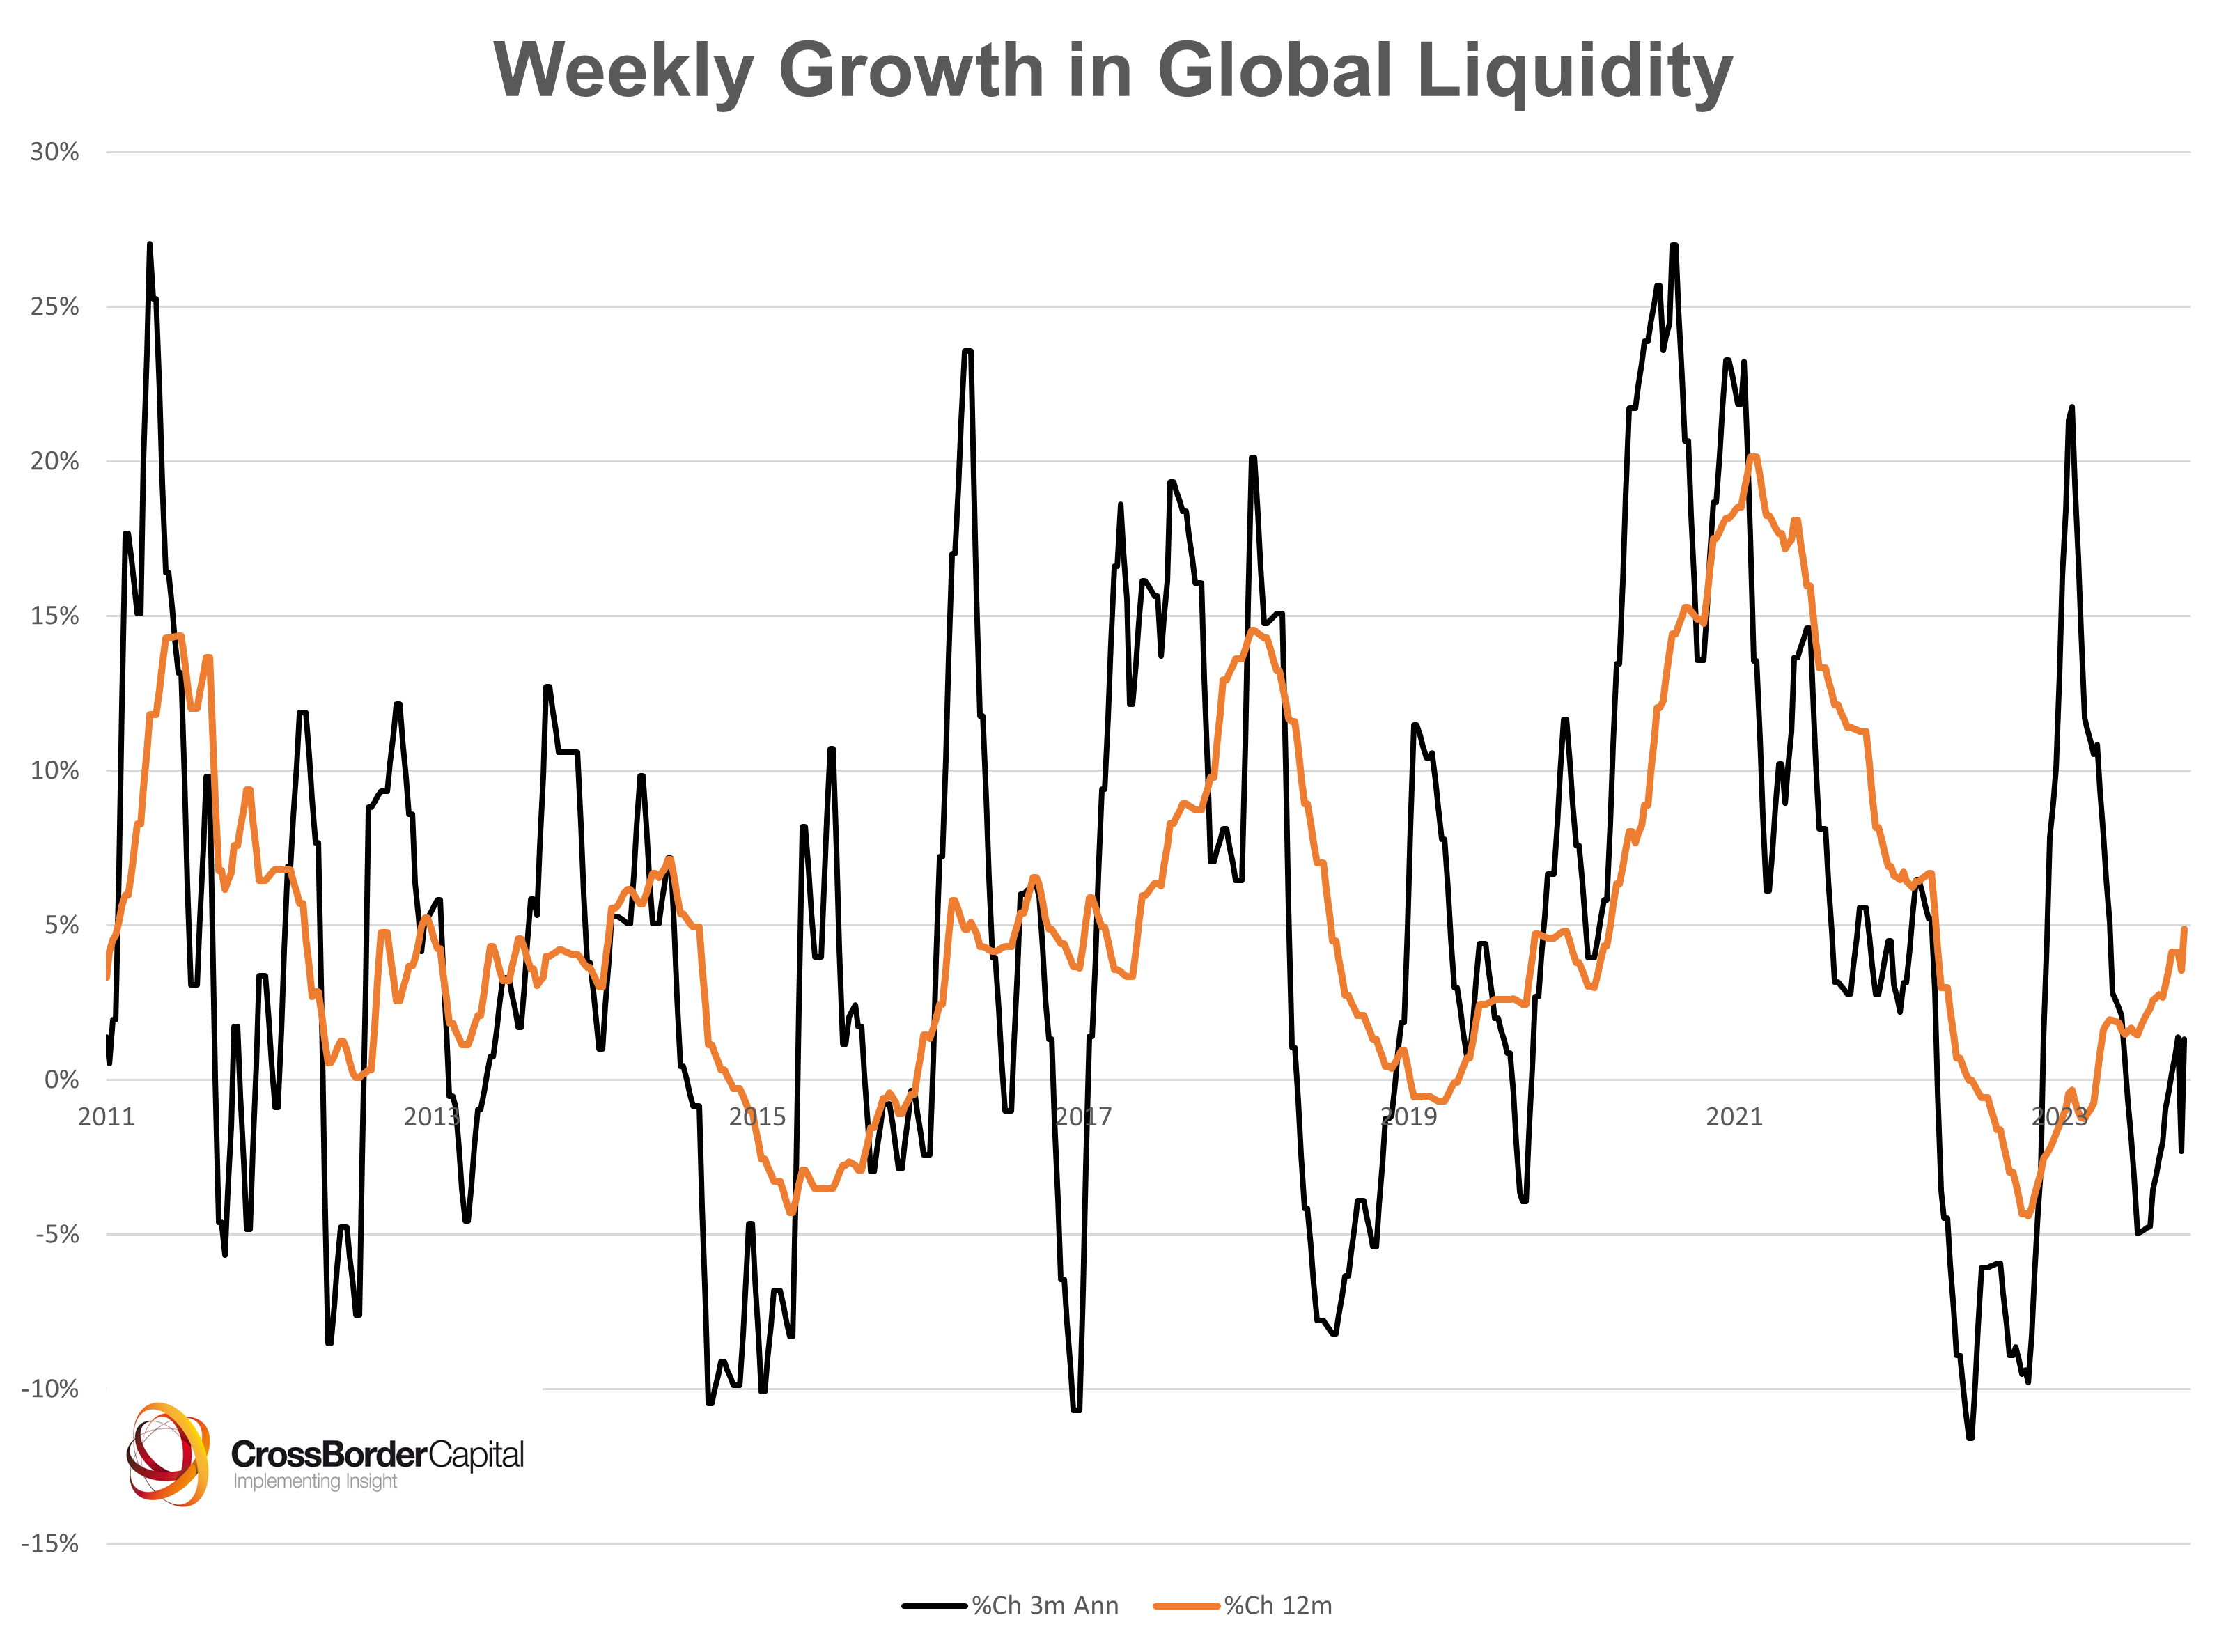
The chart below shows our weekly measure of Global Liquidity derived from Central Bank balance sheet data. Latest data show that global liquidity levels are edging higher: +1.3% (3m ann.) or up to US$166.7tr in nominal terms. Improving collateral values are behind the improvement, aided by an uptick in the shadow monetary base (SMB).
We have highlighted in previous reports the influence that volatile bond markets have on collateral values, and hence liquidity conditions. Bond market volatility, as measured by the MOVE index, recently hit 141. Last week, it slipped back to around 126. While better, it is still uncomfortably high and at risk of jumping higher again. This could dent liquidity levels once again.
Source: CrossBorder Capital, US Federal Reserve, People’s Bank of China, ECB, Bank of Japan, Bank of England
The chart below shows the 3m annualised and 12m growth rates of the World SMB. It has been sliding since June. A base effect in the data has made the 3m ann. rate of contraction even sharper (-16.1%) than in recent weeks, but, importantly, in nominal terms the SMB has turned higher. Last week saw a rise to US$88.8tr from the previous week’s US$87.8 tr. The SMB bottomed just over a year ago at US$86.4tr. This confirms our view that QT ended around this time last year.