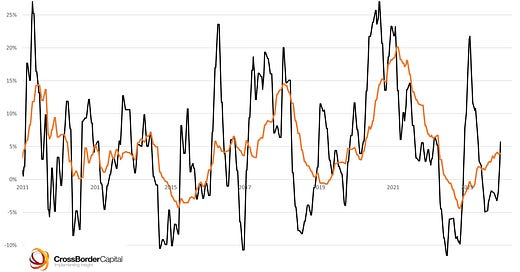
Global liquidity levels are rising according to latest data. The chart below shows our weekly measure of Global Liquidity growth derived from Central Bank balance sheet data. The +5.7% rate is the fastest recorded since April. In nominal terms, liquidity has risen to US$168.1tr, just a tad below the year’s high of US$168.7tr recorded at the time of the SVB crisis. The data further confirm our view that liquidity bottomed in October 2022 when it hit US$158.8tr. We expect liquidity levels to continue to rise before peaking in late-2025.
Keep reading with a 7-day free trial
Subscribe to Capital Wars to keep reading this post and get 7 days of free access to the full post archives.


