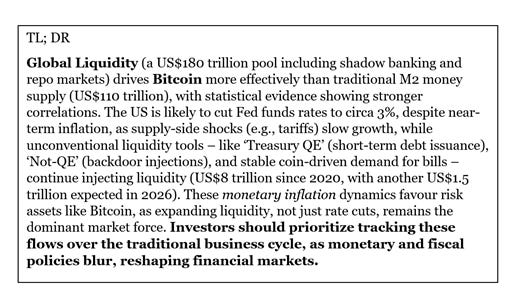
This report brings up-to-date our analysis of Global Liquidity and reexamines its role in driving Bitcoin. We draw comparisons with other metrics, namely M2 money supply. On top, we drill into prospective US policy moves and what these mean for interest rates and future liquidity. Everything appears to be coming together at once….
Investors are in a phase where liquidity management (not just interest rates) dominate market outcomes. US Liquidity has become the key driven of asset markets since the early 2000s, but the character of US Fed and Treasury liquidity impulses has changed over time. The US Fed and Treasury have employed conventional QE tools, as well as ‘Not-QE, QE’ (backdoor liquidity injections), ‘Treasury QE’ (short-term debt issuance to reduce duration) and stable coin-driven demand for bills to manage financial stability and deficit financing.
Looking ahead, the US is likely to see lower policy rates (circa 3%) and increased liquidity stimulus despite near-term inflation, as supply-side shocks from higher tariffs (taxes) slow growth and eventually curb price pressures.
Bitcoin, Liquidity and M2 Money Supply
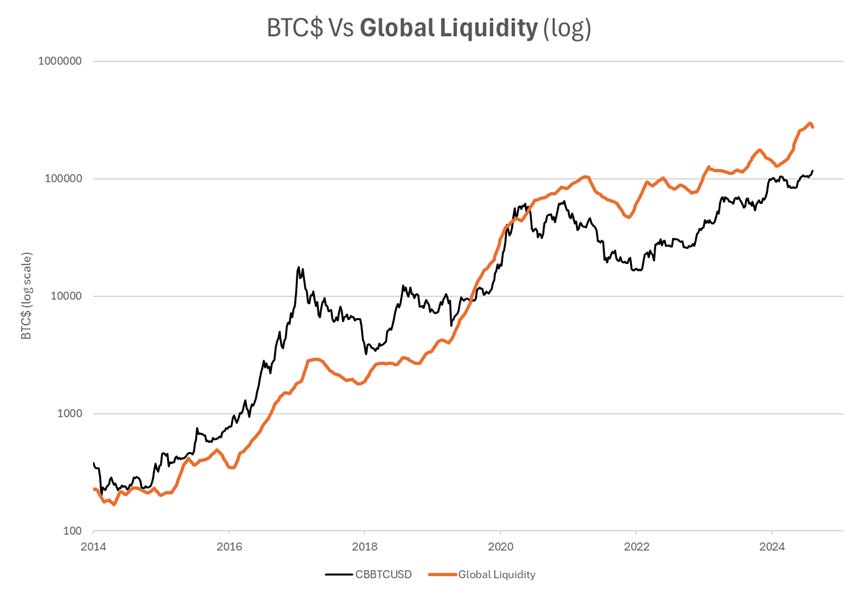
We recently investigated the efficacy of M2 money supply versus Global Liquidity as drivers of Bitcoin. It was controversial, but let’s revisit. To recap, World ‘M2 money supply’ totals US$110 trillion and consists of bank deposits held by high street banks. Shadow banking, repo market activity and other collateralized sources of credit are excluded. These might be considered as ‘broader’ components of money and they are largely used for financial sector transactions. Nonetheless, they are important and in aggregate terms add up to a whopping US$70 trillion. Adding these components defines the US$180 trillion pool of Global Liquidity.
The first chart below shows World M2 money supply versus Bitcoin. The second is the equivalent chart for Global Liquidity. Visually, we leave it readers to decide which looks the more robust relationship. However, in statistical terms the following two charts report scatterplots of both relationships, using 6-week changes to eliminate ‘noise’ and advancing both ‘monetary’ data sets by 13 weeks to test their predictive abilities. Again, the evidence is presented: make your own conclusion.
To be fair to those who favor using World money supply, it may still capture a similar trend to Global Liquidity. However, the data confirm that the cycles are different. It may be helpful to understand why? Therefore, we focus on US monetary policy below in order to show why understanding liquidity is particularly important.
The Compelling Case For US Policy Rate Cuts
Although we always emphasize the importance of liquidity over changes in policy rates, we acknowledge that the latter can be an important in framing the likely direction of monetary policy.
The tepid US economy is showing signs of further slowdown. Historically, rate cuts have closely following the tempo of the economy, as measured in the chart below by a daily nowcast of US GDP growth. The close linkage between the number of prospective 25bp policy rate cuts factored into the term structure (not Fed funds futures) and the GDP nowcast broke down in late-2024, coincident with growing uncertainty about the impact of President Trump’s proposed tariffs. The Fed’s rhetoric pulled-back, signalling a more conservative ‘forward guidance’ toward rate cuts. As a result around four rate cuts (circa 100bp) were taken off the table, according the the chart. Since these will need to be restored, we should be thinking of US Fed funds re-testing 3% on economic grounds, even regardless of whether or not Chair Powell is replaced.
The New Reality of US ‘Treasury QE’
QE (quantitative easing) operations essentially involve asset swaps. The Fed balance sheet expands by the Fed buying securities in the open market and simultaneously injecting liquidity as payment. Balance sheets still balance, but the Fed’s balance sheet has grown larger and the private sector’s balance sheet has changed its composition and, importantly, also lost duration (note: think of this crudely as ‘average maturity’). In theory, attempts by private investors to re-balance their portfolios and replace this lost duration bids asset prices higher, particularly the prices of ‘flexible’ duration assets like equities.
Put another way, the liquidity of the private sector is determined by the size of its asset holdings divided by their average duration. Thus, any change in average duration must result in a change in ‘liquidity’. These actions are not limited to the US Federal Reserve, because the US Treasury is also a major debt issuer. If the Treasury changes the composition of the US debt stock via redeeming longer-dated coupon debt and replacing this with bills, the average duration of securities held by the public will fall even though the absolute size of the debt stock is unchanged. It follows that a rising debt stock financed at the margin entirely by bills will further boost US ‘liquidity’ because both numerator (higher total assets) and denominator (lower average duration) have changed favorably. This is ‘Treasury QE’.
There is a further positive twist in this story because often a critical question is who buys this debt? Purchases of government debt by the non-bank private sector is defined as ‘funding’, because the private sector’s balance sheet does not increase. For example, a Treasury security is paid for by reducing bank deposits. However, purchase of government debt by the banks is considered ‘monetization’ since the Treasury securities can be paid for simply by increasing bank deposits. The rub here is that banks strongly favor short-dated Treasury securities and bills. Hence, as their issuance increases, so does debt ‘monetization’. This is another facet of ‘Treasury QE’.
The table below estimates the impact on US Liquidity of quantitative policies – conventional QE (balance sheet expansion); ‘Not-QE, QE’ (backdoor liquidity stimulus) and ‘Treasury QE’ (short-term Treasury bill issuance and active duration management). 2020 and 2023 saw US$4.5 trillion and US$2.4 trillion of net stimulus, not counting fiscal policies. In contrast, 2022 saw a net liquidity squeeze of US$1.2 trillion. We project a further US$1.5 trillion expansion in 2026 based on latest policy guidelines. Overall since 2020, the US Fed and Treasury will have injected more than a whopping US$8 trillion of ‘liquidity’ into World financial markets.
The following chart shows the monthly profile of these inflows. The pattern shows a clear cycle of liquidity that affects both markets and business activity.
Conclusion: Monetary Inflation, Not Financial Repression
Looking ahead, the US is likely to see lower policy rates (circa 3%) and increased liquidity stimulus despite near-term inflation risks, as supply-side shocks from higher tariffs (taxes) slow growth and eventually curb price pressures. The Fed and Treasury are employing unconventional tools – including ‘Not-QE, QE’ (backdoor liquidity injections), ‘Treasury QE’ (short-term debt issuance to reduce duration), and stable coin-driven (and fractionalized Defi) demand for bills – to manage financial stability and deficit financing. Since 2020, these policies have injected some US$8 trillion of liquidity, driving asset markets and business cycles, with another US$1.5 trillion expected in 2026.
A rising tide of Global Liquidity lifts many (asset) boats. We recently argued in favor of ‘Risk On’. Bitcoin remains a key beneficiary of expanding Global Liquidity. Investors must prioritize tracking liquidity flows over traditional cycles, as innovative policies blur monetary/fiscal lines and reshape credit creation, with the coming of stable coins potentially shifting power toward government intermediation and liquidity growth.
The US is likely heading toward:
Lower rates (circa 3%) despite near-term inflation
More liquidity injections (US$1.5 trillion in 2026)
Continued unconventional policy tools (Treasury QE, stable coin-driven demand)
Investment Implications
Risk-On: favor Bitcoin, equities, and growth assets
Watch for Fed rate cuts and monitor US Treasury bill issuance trends
Stable coin growth is a potential new liquidity multiplier for crypto


Thanks Michael. Very insightful . Initially, you project that the liquiditu will peak this Q4 2025. Has it been pushed back to 1st half of 2026?
So no bear market.