
Broken China
Part 1: Policy of ‘Stop-Go-Stop’ Hits Liquidity and Unglues the Economy

When will China ease Liquidity? We argue here that two factors have caused the People’s Bank to cut back liquidity provision: (1) a weakening Yuan, and (2) seasonal weakness, that will later unwind.
Continuing deflation across domestic goods and asset markets evidence that China’s real exchange rate is too high. Consequently, market forces (and capital flight) are weakening the Yuan are hurting the Chinese economy. The juddering stop-go-stop pattern is the result of the People’s Bank’s (PBoC) monetary policy response. The World economy is also suffering. The chart below highlights PBoC Liquidity injections and the subsequent growth of the World economy based on our AI-based model that estimates daily World GDP momentum from commodity prices, forex markets and corporate credits. The correlation is too close for comfort.

Evidence also the changes in PBoC Liquidity as taken from published monthly balance sheet data shown in the next chart. The dramatic policy switch from 2014 towards greater use of domestic open market operations (black region), as a precursor to the PBoC taking more control of Yuan money markets, is plain. The 6-month annualised growth rate of PBoC liquidity is highlighted (red line). This recently peaked at nearly-15% in late-2023 as the PBoC ploughed in liquidity after a short-lived recovery in the Yuan. However, recent renewed downward pressure on the Yuan has forced a renewed tightened of PBoC liquidity confirmed by plunging PBoC liquidity growth.

The tight connection between PBoC operations and Yuan weakness is reported below. This shows the size of liquidity injections against the premium/ discount on the off-shore Yuan (CNH). A weaker off-shore Yuan leads to a tightening of Chinese money markets. Monetary policy is dictated by the Yuan.

Put into a wider context, the resulting slowdown in aggregate Chinese liquidity growth has been significant. The next chart compares the size of the PBoC balance sheet to its pre-2014 trend (dotted line). The sizeable shortfall goes some way to justify the secular slowdown in the pace of Chinese GDP growth over the past decade.

Slower Chinese liquidity growth is broadening out beyond the People’s Bank (PBoC). It now also involves Chinese commercial and shadow banks, which are indirectly affected through tougher PBoC policy directives on lending. This can be seen in the chart below, which records the slowing trend in aggregate liquidity growth alongside the recent sharp dip in policy liquidity.


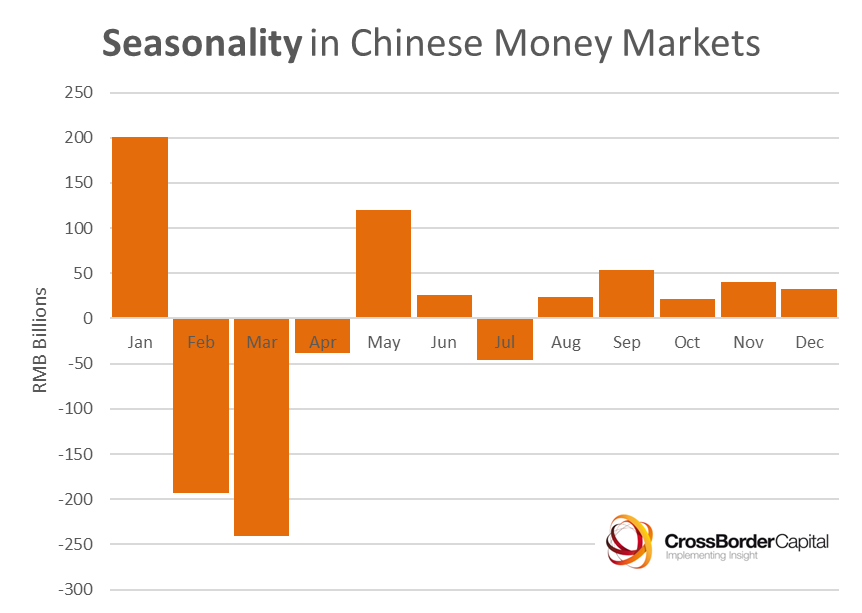
Defending the weak exchange rate has not been the only negative factor shaping Chinese liquidity provision over recent weeks. Overlaid on top is also a heavy and temporary seasonal effect. China’s less sophisticated financial system suffers large swings in liquidity through the year, largely linked to the rural economy. America’s financial system suffered similar swings a century ago. August through January typically see money market surpluses, whereas February to July (except for May and June) suffer deficits. The scale of these deficits, often coinciding with the Lunar New Year holiday, often make it hard to read extant PBoC policy intentions. But, looking ahead, there are, therefore, good seasonal reasons to expect more Chinese liquidity during the second half of 2024.
This seasonality echoes through the official monthly data on Total Social Financing (TSF). TSF data is widely quoted and often used as a barometer of policy stimulus. Yet, as the chart below shows, it is a highly unreliable gauge of Chinese Liquidity expansion. Not only do seasonal swings again dominate the data, but the published numbers involve substantial ‘double-counting’ which means the true liquidity-impact is often far less than hoped. At best, the monthly increases in Chinese Liquidity are flat-lining at just under RMB2 trillion.

Drilling further into this data shows that the once rapacious Shadow Banks have been successfully restrained by the Chinese monetary authorities. Growth across all areas of shadow banking has cooled dramatically. Much of these flows financed local authority land and infrastructure deals.

Conclusion: Watch The Yuan…and the US Dollar
One lesson from the latest data is that China’s monetary authorities are back in control. Nonetheless, Chinese liquidity is still largely constrained by the need to manage capital flows and the exchange rate. A stable or controlled decline in the Yuan towards a level of around RMB8/US$ (see Part 2) will allow the Chinese authorities to ease domestic liquidity conditions. While the US dollar is strong this seems unlikely. Some respite will come in the second half year as negative seasonal factors unwind, but a major liquidity boost is dependent on the forex markets. Once again, the US dollar may be key…
[Part 2 looks more closely at the Yuan and its real exchange rate adjustment.]
I believe they 'accept' that the Yuan is too high. Policy makers typically care most about rates of change, so a gradual slide against a backdrop of liquidity expansion could be acceptable in coming months.
Liquidity is starting to ease and I suspect that PBoC is comfortable with a gradually sliding )not skidding) Yuan. If we are correct this should open door to a stronger domestic market and a final end to asset price deflation