

Executive summary: Crypto weakness does not invalidate the longer-term debasement thesis. Rather, it highlights the importance of distinguishing between structural demand for monetary hedges and the cyclical liquidity impulse that drives risk appetite. Bitcoin remains highly sensitive to Fed-led Global Liquidity, which is currently slowing, while gold appears better supported by PBoC liquidity, reserve diversification and geopolitical demand. The tactical implication is that crypto may struggle to regain sustained upside momentum until Fed Liquidity re-accelerates.
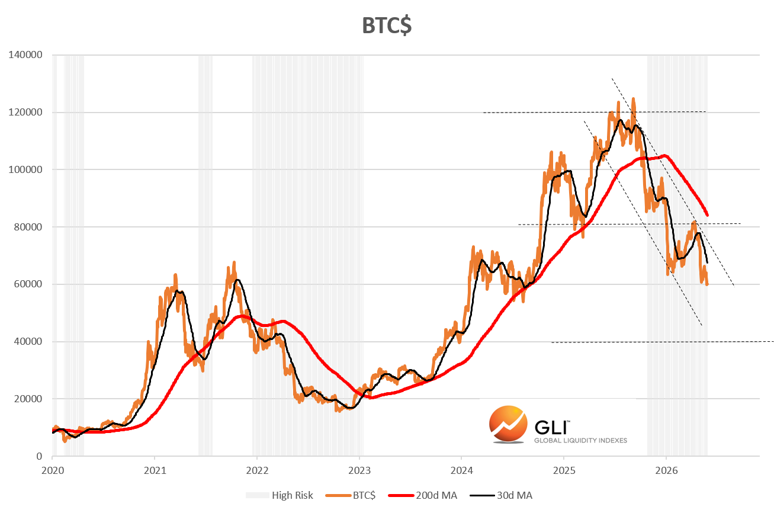
Cryptocurrencies have slipped into a bear market. The Bitcoin chart below suggests that a further fall towards US$40,000 remains difficult to rule out. At first glance, this looks counterintuitive: Bitcoin and other digital assets have established a credible track record as monetary inflation hedges, and there is broad agreement that policymakers have limited room to respond to rising welfare costs, higher defense spending and tax-weary electorates without resorting to further money creation. Last year’s rush into monetary hedges was reinforced by fears that President Trump might install a compliant Fed Chair, as well as by evidence that China and others were shifting reserves away from the US dollar and towards gold. However, investors should be careful not to confuse cyclical weakness with more positive longer-term trends.
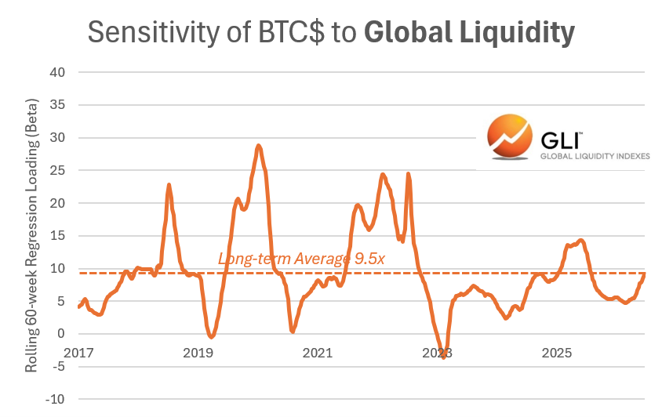
Cryptocurrencies, including Bitcoin, are highly sensitive to changes in Global Liquidity. A rolling 60-week regression loading shows that, despite fluctuations, this sensitivity is currently in line with long-run averages. The problem for crypto is twofold: first, Global Liquidity growth has slowed below its trend; second, investor sentiment has turned against the asset class. We consider each in turn.
Slower Global Liquidity
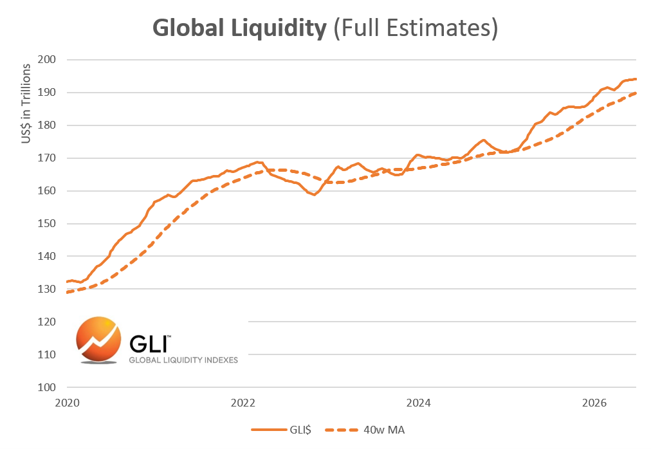
We define Global Liquidity as the flow of funds through World financial markets. Although its absolute value in US dollar terms continues to inch higher, its pace has slowed. Admittedly, we thought a more rapid slowdown was underway last November, but the US Fed offset this with additional stimulus through a new QE tranche dubbed RMP, or Reserve Management Purchases.
The latest Global Liquidity data now appear to confirm evidence of a renewed slowdown. This is not because central banks are tightening aggressively. Rather, a strengthening World real economy is absorbing funds and crowding out financial uses. All money that is anywhere must be somewhere; if liquidity is shifting into the real economy, it is not available to drive financial asset prices higher.
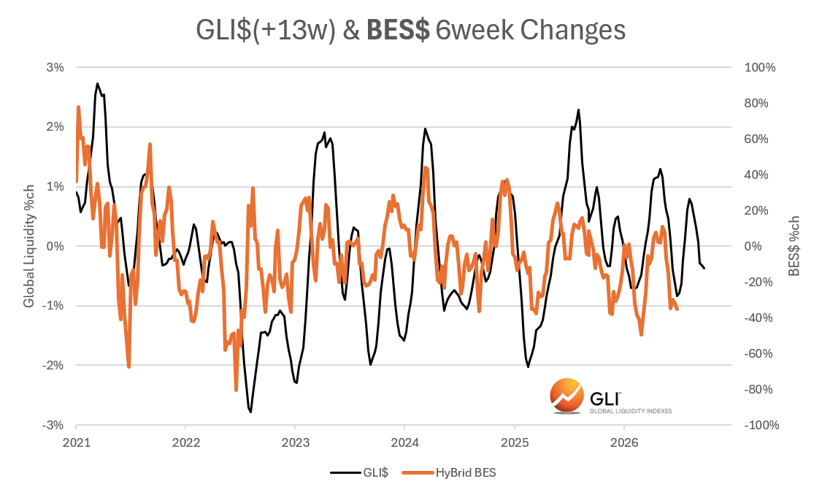
Crypto is especially sensitive to these inflections, as the following chart shows. It highlights the close short-term correlation between six-week changes in a cryptocurrency basket (BES$ – 60% BTC$, 30% ETH$ and 10% SOL$) and the equivalent change in Global Liquidity advanced by 13 weeks to reflect its lead time. Since 2024, this relationship has produced an R-squared of 0.32.
Adverse Investor Sentiment
On top of fading liquidity support, investor sentiment has turned sharply negative against crypto relative to gold. The chart below reports the Bitcoin/gold price ratio alongside its 50-day rolling average. There may still be a gradual uptrend, but Bitcoin has fallen sharply against gold towards the low end of its recent range.
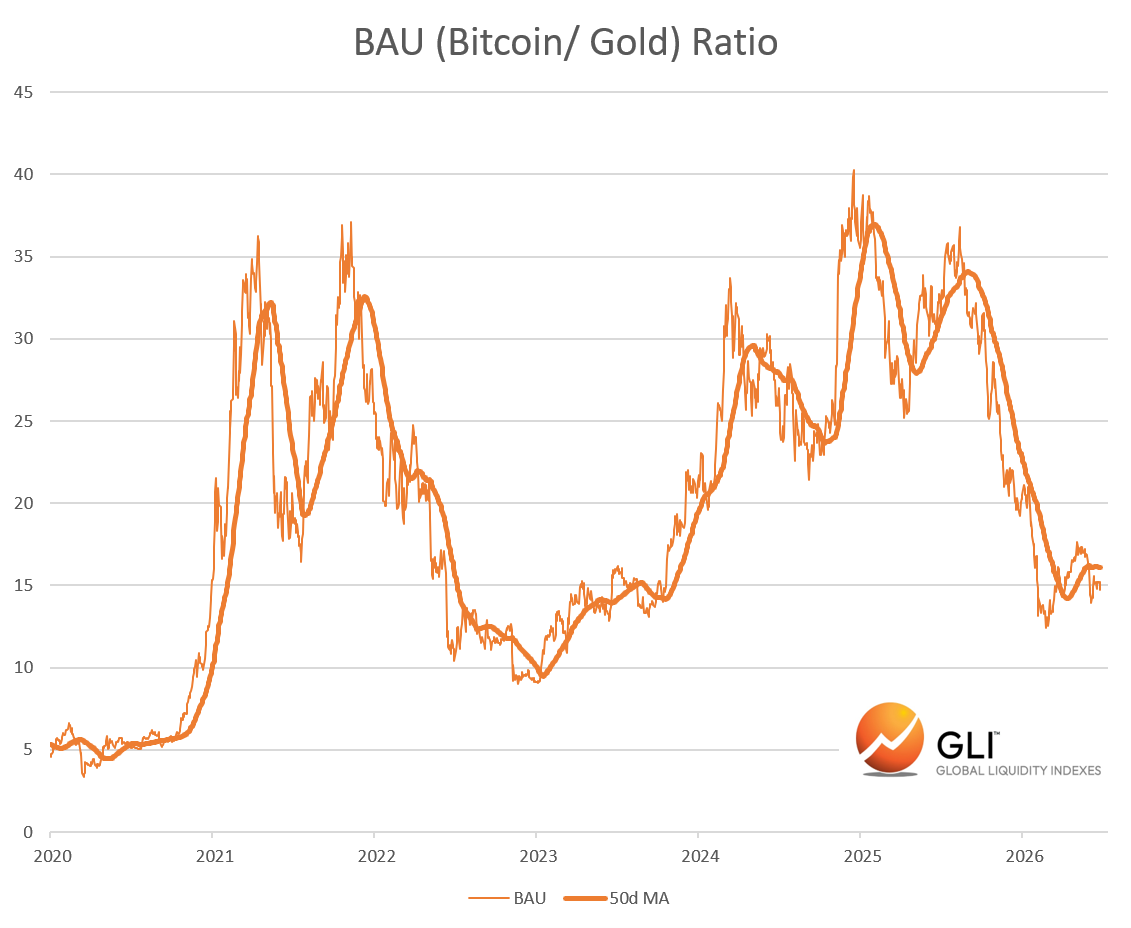
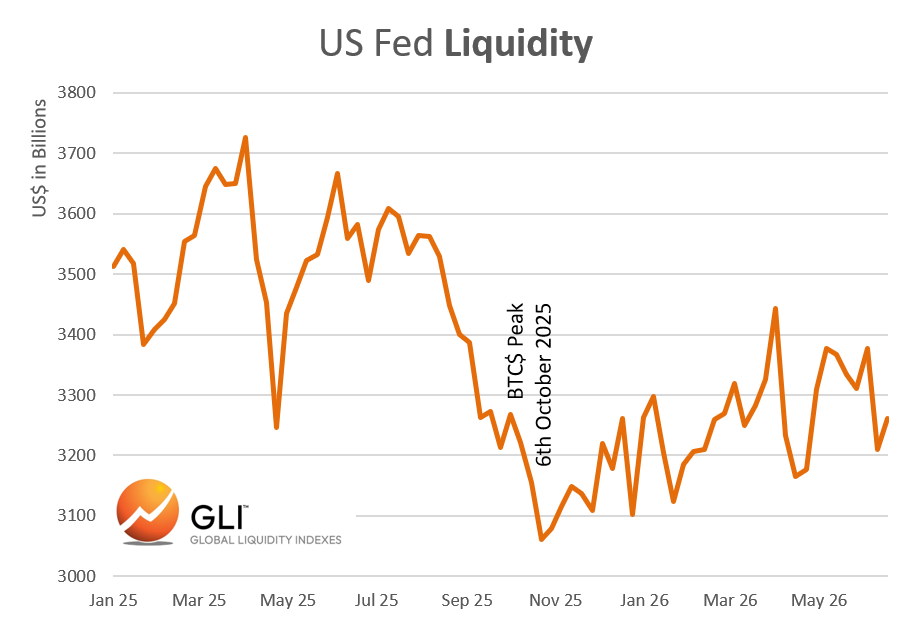
Several factors could explain this decline, from Bitcoin’s greater sensitivity to slowing liquidity to the larger leverage typically embedded in cryptocurrency positions. We remain equivocal. Nonetheless, Bitcoin appears to have led gold lower: it peaked on 6 October 2025, whereas gold’s peak came later, around early March 2026.
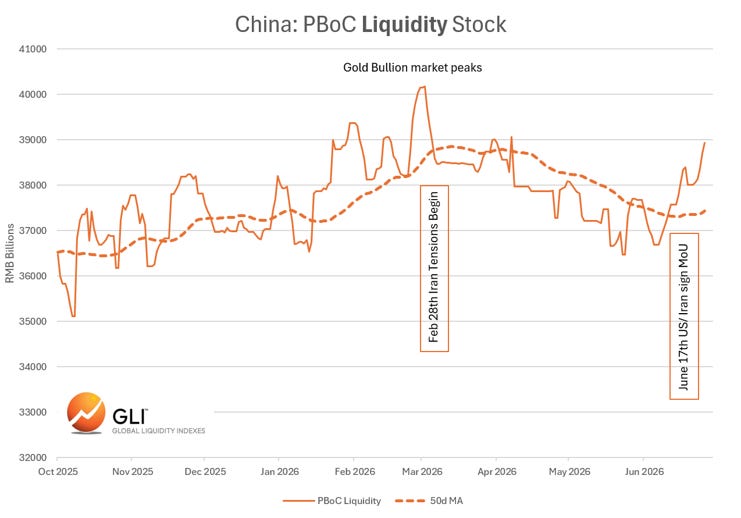
This sequencing fits our previous narrative. In our view, the US Fed is more important for the Bitcoin price, whereas the People’s Bank of China (PBoC) is a crucial driver of gold. China disallows crypto investment but encourages private gold holding, and the People’s Bank is itself a major bullion buyer. The following two charts identify peaks in Bitcoin and gold shortly after similar peaks in US Fed and later in PBoC Liquidity. This may simply be coincidence, but, as the second chart suggests, the PBoC’s moves also align with recent geopolitical events in the Gulf.
Future US Fed Policy
The previous chart suggests that China’s People’s Bank has already begun to rebuild balance-sheet liquidity. The Fed picture is less positive. Looking ahead, Fed Liquidity is likely to slow further, as our projections in the following chart show.
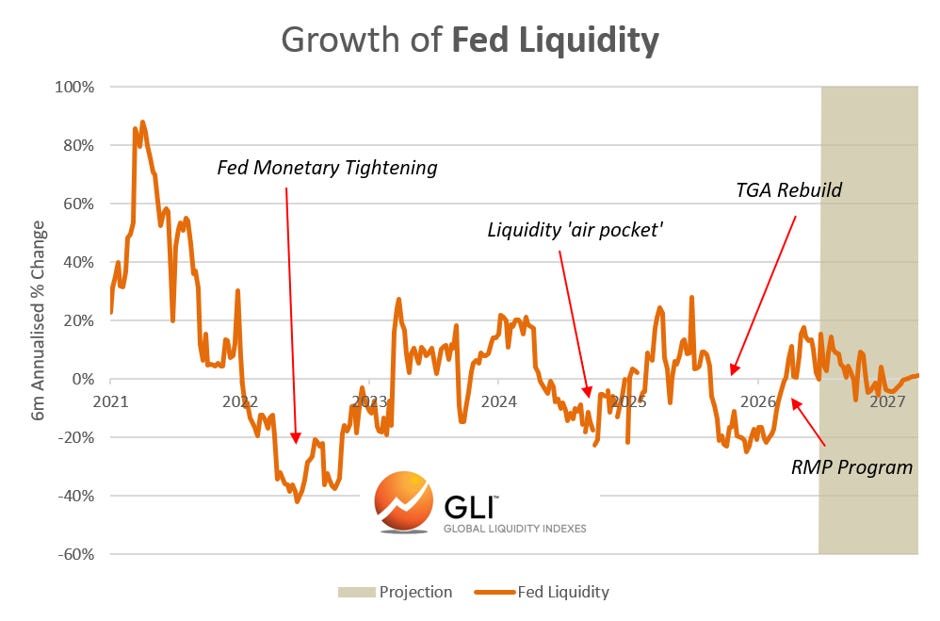
These projections of Fed Liquidity growth point to a gradual, not an abrupt future slowdown. Consider, how Fed Liquidity skidded badly in late 2025 as policymakers rebuilt the TGA, or Treasury General Account. This buffer withdraws liquidity from money markets and has grown in line with increased bill issuance and large weekly Treasury auction sizes. Nonetheless, the negative fallout across repo markets from reduced Fed Liquidity forced policymakers to devise a new support tool, RMP, or Reserve Management Purchases. This fact underscores the Fed’s flexibility.
The RMP injections were intended to be temporary and were likely skewed towards the front of the fiscal year, when large tax payments typically tighten US money markets. That appears to be the case so far, with the latest evidence showing a noticeable tailing-off in the size of weekly RMP through late June.
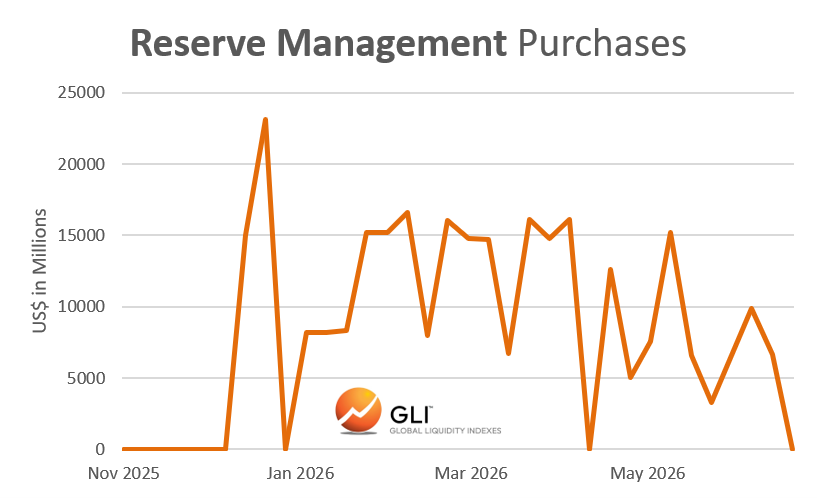
This fits US Treasury policy, which has lately stressed the intention to favour Main Street over Wall Street. We describe this as a shift to ‘Treasury QE’ from ‘Fed QE’. It does not mean policymakers will ignore Wall Street and financial markets, but they are no longer the main focus. Rather, the Fed and Treasury appear willing to provide support as needed, without delivering the sharp stimulus that catapulted markets higher through 2023–25.
This explains our previously stated negative view on crypto this year for cyclical reasons, and our projection that Wall Street would be range-bound at best. We see no reason to change that stance.
We take a ‘Goldilocks’ view, where US policymakers are likely to provide just enough liquidity to maintain market stability. In short, a gradual monetary inflation. We do not foresee major liquidity injections unless tensions rise. In practice, this means Fed Liquidity should gently trend higher from around its US$3.3 trillion base, while bank reserves are likely to hover above US$3 trillion. Note that a hungry real economy will still demand much of this new cash.
We have previously argued that, despite the building domestic inflation pressures and strong economy, we do not expect the Warsh Fed to raise the Fed funds rate hurriedly. Instead, we believe the Fed will welcome markets doing the tightening for them by keeping money-market liquidity in check and allowing long-dated bond yields and the US dollar to grind higher.
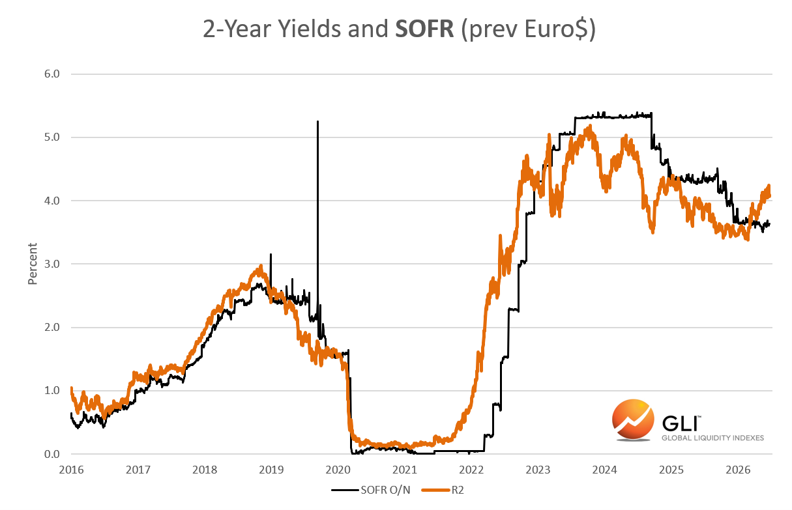
Rates markets already signal tighter liquidity. The chart below shows repo rates against the yield on the two-year Treasury note. Short-term Treasury yields are especially sensitive, and their rise above SOFR rates hints, much as it did in 2021–22, that the market expects tighter monetary conditions ahead.
For crypto investors, the near-term objective is therefore less a renewed bull market than the formation of a durable floor. The next sustained crypto upswing still looks some time away.
Disclaimer
The information is provided for information purposes only and on the basis that it will not be relied upon. No information contained herein constitutes a personal recommendation or investment advice.
The information (including any expressions of opinion or forecast) have been obtained from, or is based on, sources believed by the author to be reliable, but are not guaranteed as to their accuracy or completeness and should not be relied upon. The information is provided without obligation on the part of the author and on the understanding that any person who acts upon it or changes his investment position in reliance on it does so entirely at his own risk. The information does not constitute an offer to buy or sell or an invitation to make an offer to buy or sell any financial instrument.
Information is current only as at the date it is first posted and may no longer be true or complete when viewed by you. All information may be changed or amended without prior notice.
No representation, warranty or undertaking is given as to the accuracy or completeness of the information by the author and no liability is accepted by the author for the accuracy or completeness of such information. In no event will the author be liable to any person for any direct, indirect, special, or consequential damages arising out of any use of the information, including, without limitation, any lost profits.
You should be aware that the Internet is not a completely reliable transmission medium. The author does not accept any liability for any data transmission errors such as data loss or damage or alteration of any kind, including, but not limited to any direct, indirect or consequential damage, arising out of the use of the product or services referred to herein.
The materials provided here including text, photographs and other images, are protected by copyright and/or other intellectual property rights. All copyright (and any other intellectual property rights) in these materials is either owned by the author, or is used by the author under licence.
Hi Michael, my understanding of what you are saying and the chart is that PBOC is starting to reinject liquidity which provides support for gold. You had an article last week that said USD 3700/ RMB 25000 per oz is a good entry point into gold. In light of the recent increase by PBOC are you now advocating an entry point for gold longs higher than $3700 ?
Are you discounting the effects of a potential « Bank QE » on top of Fed and Treasury QE??
Seems like we could see treasuries being removed from SLR and therefore the banking sector would take this business from the Fed