

The Crest of A Wave
The Crest of A Wave
What To Watch In Order To Understand Coming Global Liquidity Shifts

Markets move in cycles and follow trends. Both are driven, in our view, by ‘Liquidity’, which we measure from changes in the financial sector balance sheet. Financial markets do not create ‘efficiency’ in the economic sense of always being corrected priced, rather they provide ‘liquidity’ in an uncertain World and because of this they are inherently cyclical. The liquidity view argues that asset prices are determined by the capacity of financial sector balance sheets, Central Bank injections of cash and by the price of government bonds, rather than by corporate profits and policy interest rates. Evidence how the ability to post bonds as collateral in the repo market allows the creation of new lending. What’s more, liquidity is fungible and since we live in an interconnected World, the correct aggregate to monitor is Global Liquidity.
This framework gives important insights in a debt-driven World. First-and-foremost, financial markets increasingly operate as vast debt refinancing mechanisms not new capital-raising vehicles. Second, domestic and international capital flows represent key drivers of the economic system. Increasingly cross-border flows determine trade balances, not vice versa. These flows tend to move cyclically in harmony with the 5-6 year periodicity of debt refinancing. Re-fi dominates capital raising for new investment projects by around 3:1 and, hence, imposes a shorter business cycle than the traditional 9-10 year cycle associated with the replacement of capital goods. As a result, they suggest that the business cycle is more a cycle in the changing duration of the capital structure than fluctuations in the pace of economic growth.

Our detailed monthly calculations of Global Liquidity, as shown in the above chart, include data from close to 90 economies Worldwide. The cycle last bottomed in October 2022 and looking ahead appears slated to peak in late-2025. A 5-6 year sine wave has been added on top. We have often noted that three factors, above all, matter most in driving this cycle: (1) US Federal Reserve; (2) the People’s Bank of China (PBoC) and (3) the MOVE index of US Treasury market volatility.
Fed Chairman Jay Powell’s August speech at the 2024 annual Jackson Hole symposium abruptly shifted the course of US monetary policy towards ease. He foreshadowed interest rate cuts, and his words did not disappoint those bullish pundits who predict aggressive cuts. Inflation has supposedly been whipped and the FOMC is now turning towards stabilizing the labor market. Nowhere did he question the position of the dollar, and by default US policy makers appears to accept that it could decline further. Given that many rival economies set their monetary policies to maintain parity with the US dollar, Fed easing and a weaker US exchange rate will likely spur easing across international markets.
A weaker US unit will particularly take pressure off the hard-pressed Yuan and allow China’s PBoC to engage in a much needed policy easing. Indeed, in the two days since Chairman Powell spoke, the PBoC injected a whopping RMB1042 billion (US150 billion) into Chinese money markets. Whereas, Fed liquidity injections tend to drive World financial markets, given the dominance of the US dollar, PBoC actions impact the World real economy and commodity markets because of China’s giant industrial footprint.
The third factor to watch is US bond market volatility. Throughout history, the most important ‘price’ in World financial markets is the price (i.e. yield) of the dominant economy’s debt, e.g. US Treasury notes. [For a foreign investor this includes a currency dimension too]. We argue that this key price plays a vital and, in fact, an ever bigger role in creating ‘liquidity’ in modern financial markets.
Consider, retail or deposit banking as the conventional model of a bank. In contrast to wholesale banks, retail banks attract deposits. They then use this cash to lend to others multiplicatively, under fractional reserve accounting. This is the so-called deposit multiplier model much-loved by textbooks, but it is incorrect in practice because loans create deposits and not vice versa.
Wholesale banking is also different. Wholesale banks hold collateral, not deposits, and they, therefore, operate through a collateral multiplier, not a deposit multiplier. Instead of deposit funding, a wholesale bank taps the repo markets. It buys Treasuries and borrows cash against these collateralised securities to invest or lend to others. A wholesale bank’s liabilities are repo borrowings, not deposits. This places US Treasury notes and bonds at the very centre of the modern monetary system. Lately, bank regulators have been attempting to further reduce and even remove Treasuries from capital ratio requirements. This should allow banks to significantly expand wholesale bank lending much further. This growing importance of Treasuries among domestic banks could even mean that governments, in general, become less dependent on foreign demand for their debt.
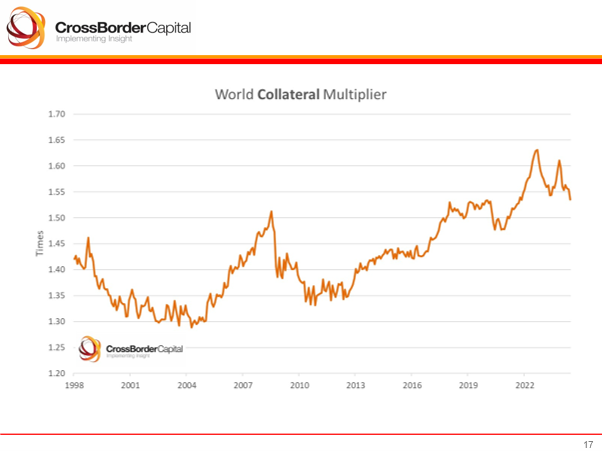
The ability to borrow against Treasury collateral depends upon the haircut demanded by credit providers. The size of this haircut determines the leverage of the financial system. Thus, the availability of more pristine collateral and low price volatility both mean greater liquidity creation. The chart below reports our estimates of this collateral multiplier. We define it as the ratio between Global Liquidity and the so-called Shadow Monetary Base, an aggregate consisting of the Central Bank liquidity pool, plus eligible collateral and any off-shore pockets of liquidity, such as fx-swaps and/ or sourced from the once powerful Eurodollar market. The multiplier has trended higher since the mid-2000s to its current reading of 1.53 times. Although it fell heavily during the 2008/09 GFC, it since rebounded strongly.
The MOVE index, a measure of bond volatility across the US Treasury curve, does not only measure how much bond prices are shifting, it also determines liquidity creation via the size of the collateral haircut. Consider, a dealer bank that wants to borrow against collateral using US$10 million in Treasuries. If the credit provider sees a high and elevated MOVE index, it might only lend US$9 million as it fears the US$10 million in Treasuries could fall to $9.5 million in value. The greater is bond volatility, the larger the haircut and the smaller the collateral multiplier. In theory, a 5% haircut could underpin a sizeable 20x collateral multiplier, but a 10% haircut would reduce this to 10x.
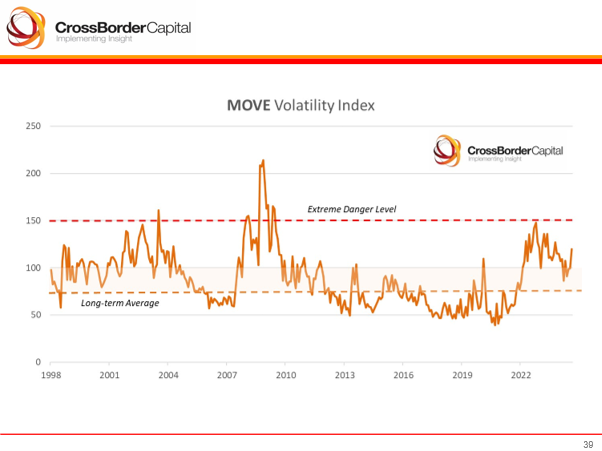
The chart below plots the MOVE Index monthly since 1998. The lower the MOVE index the greater the efficacy of collateral. We denote the long-term index average at circa 70, and the 150 level that many traders consider as ‘extreme danger’ levels when the markets become dysfunctional. The grey band depicted in the chart represents a ‘comfort zone’ where we expect bond volatility to settle. Indeed, the latest US Treasury Buyback Program may be implicitly targeting lower bond volatility through buying in stale or so-called ‘off-the-run’ Treasury issues.
The correlation between the MOVE index (inverted) and changes in the size of the collateral multiplier is reassuringly close, as the next chart confirms. In short, the creation of collateral-based liquidity, via the actions of wholesale banks borrowing in the repo markets, can significantly impact asset prices. This pool of liquidity depends to a large extent on a low and stable level of bond volatility. In turn, this fact highlights the importance of closely monitoring the MOVE index. It also makes the MOVE Index primary and arguable more important ex ante than the VIX index of stock market volatility.

In summary, our analysis confirms that the Global Liquidity Cycle is on-track to hit its peak next year: the Fed now wants to ease; China’s People’s Bank needs to ease, and a lower MOVE index, helped by US Treasury buy-backs, will spur private banks to loosen credit conditions further. A useful heads up comes from an aggregate index of international Senior Loan Officers’ Opinion Surveys (SLOOS). The chart highlights the sharp dip in the percentage of major banks Worldwide that plan to tighten lending standards. In short, Global Liquidity looks set to rise more. Of course, this cyclical pick up comes on top of a major uptrend in Global Liquidity arising from the need to finance the fast-rising burden of sovereign debt. We know cycles have to end, but the big money is always made from trends! More on these fast trends next time

.
If you compare actual 10y with synthetic estimate from agency mortgage market it is just over 100bp lower. This is YCC arising because of change in mix of issuance. This gap could close if mix retuned to normal. Outside of this effect, rising liquidity will cause YC to steepen. FF may fall 100-150 BP. Answer hence depends on assumptions, but they could given time. I don't believe in recession until 2026 which makes the prediction more likely I suppose!
Hello Michael do you believe the 10y will rise to 5.25 before the recession?